How to check for data errors
Checking vehicle and GPS data for errors helps identify potential anomalies or errors that need further investigation. Prism offers 'reports' feature that generates documents based on vehicle data and activity for the month which can be reviewed for spotting any potential anomalies.
What are prism reports?
Prism reports help provide details about the vehicle and vehicle data statistics and also aid in understanding if there are any unusual vehicle or driver behaviour.
There are currently 7 prism reports which are available in prism web application.
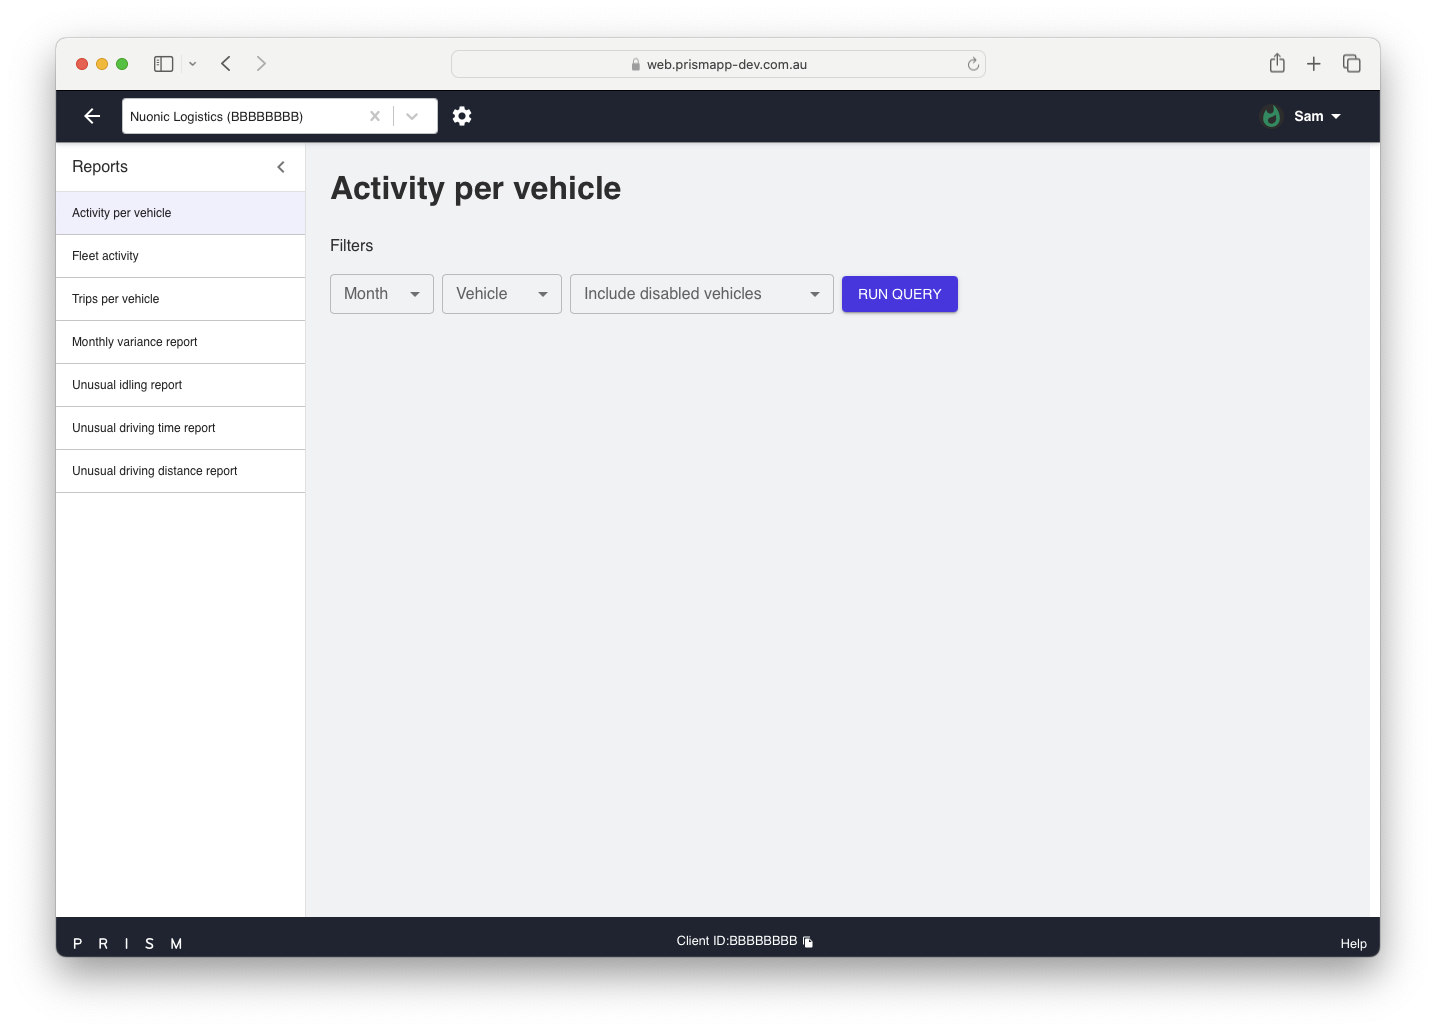
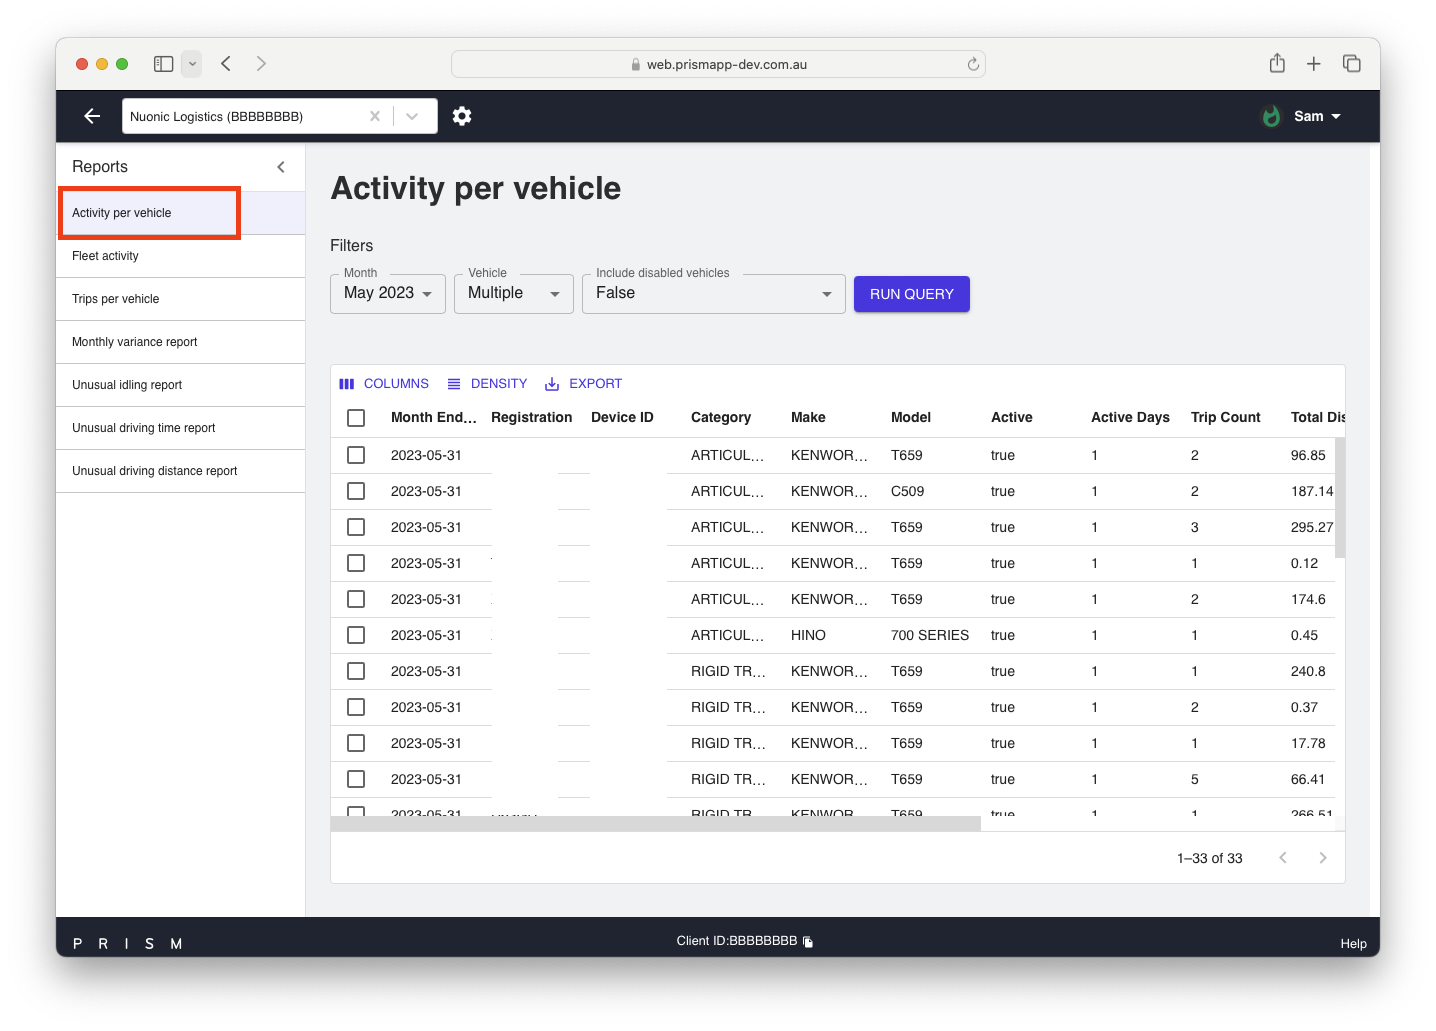
Activity per vehicle report
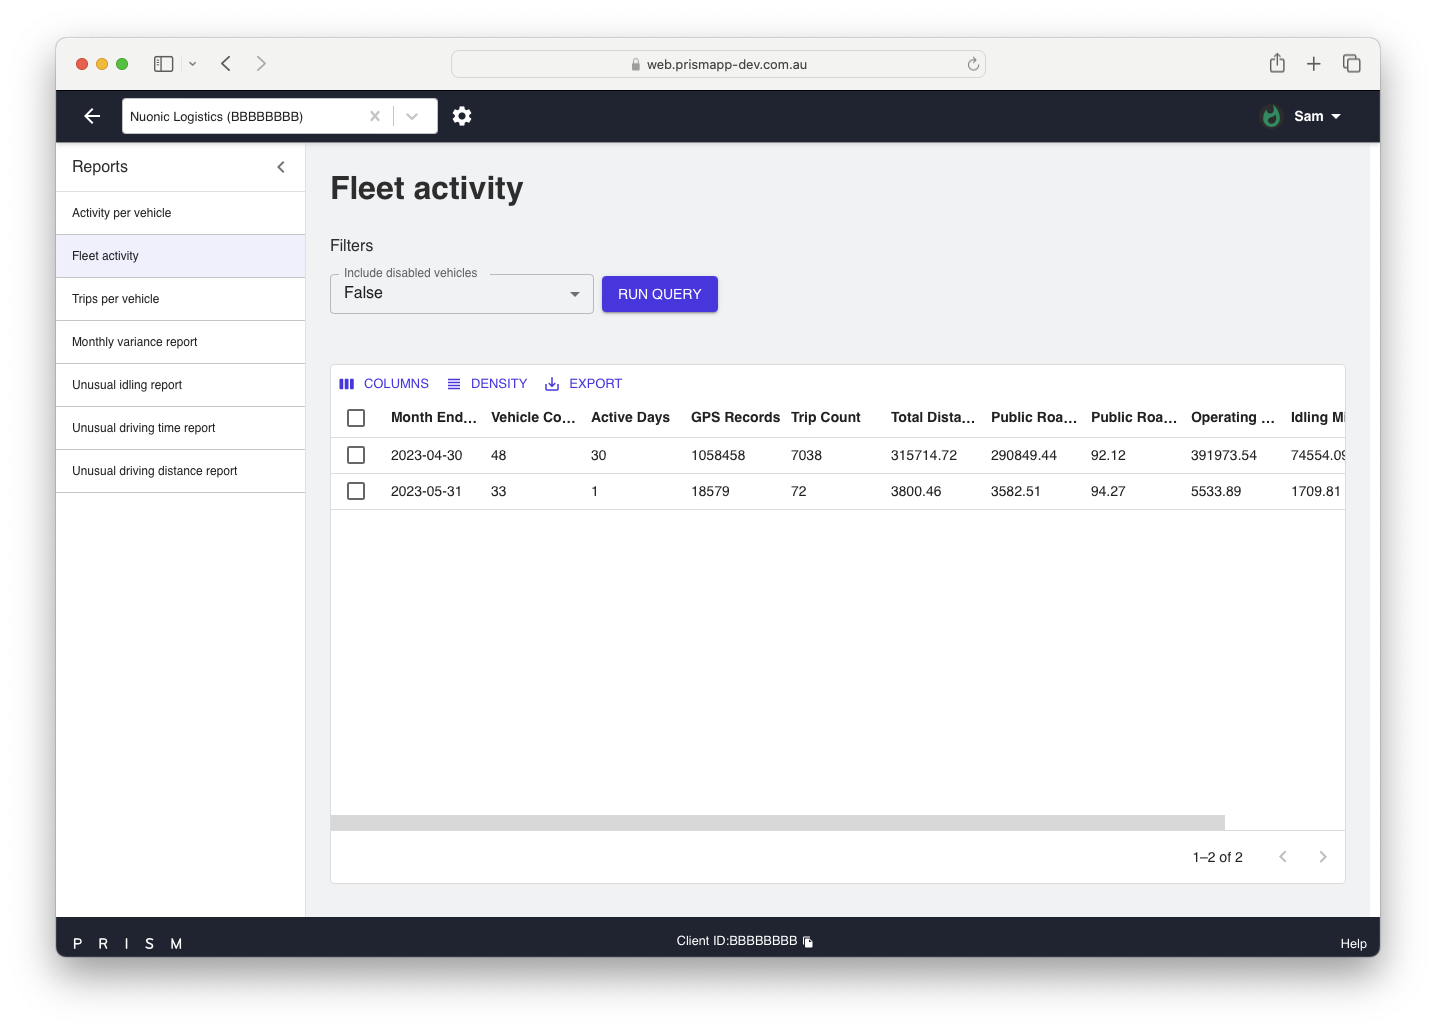
Fleet activity report
Trips per vehicle report
Monthly variance report
Unusual Idling time report
Unusual driving time report
Unusual driving distance report.
How can I access these reports?
Please see the steps below to access prism reports
Login into your prism account at https://web.prismapp.com.au/login
Once logged in, navigate to the ‘Reports’ section in the homepage and select to view the available reports.
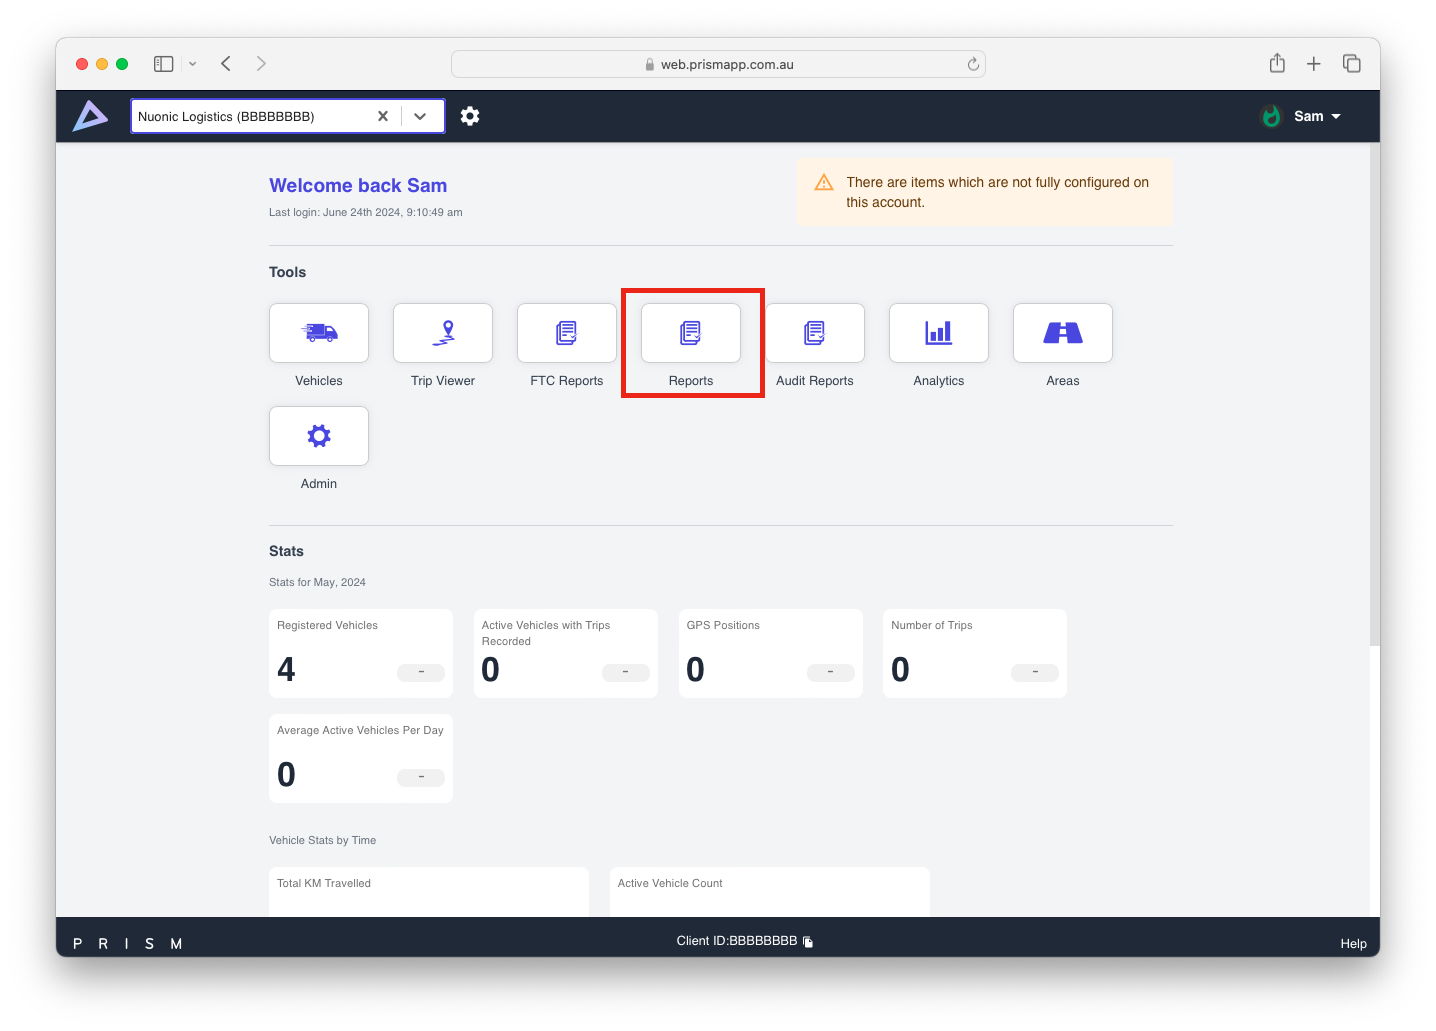
In the ‘Reports’ section, you will find options to filter and generate results for your desired report
What are these reports and how do I interpret these reports?
In the reports section, you will find options to generate details and information based on the following
Activity per Vehicle Report:
Provides details about each vehicle's distance traveled on public and non-public roads, minutes spent operating, idling, and the percentage of time spent operating.
Fleet Activity Report:
This report offers an overview of the entire fleet's activity, including active days, GPS records, trip counts, total and public road distances, operating and idling minutes, and operating percentage.
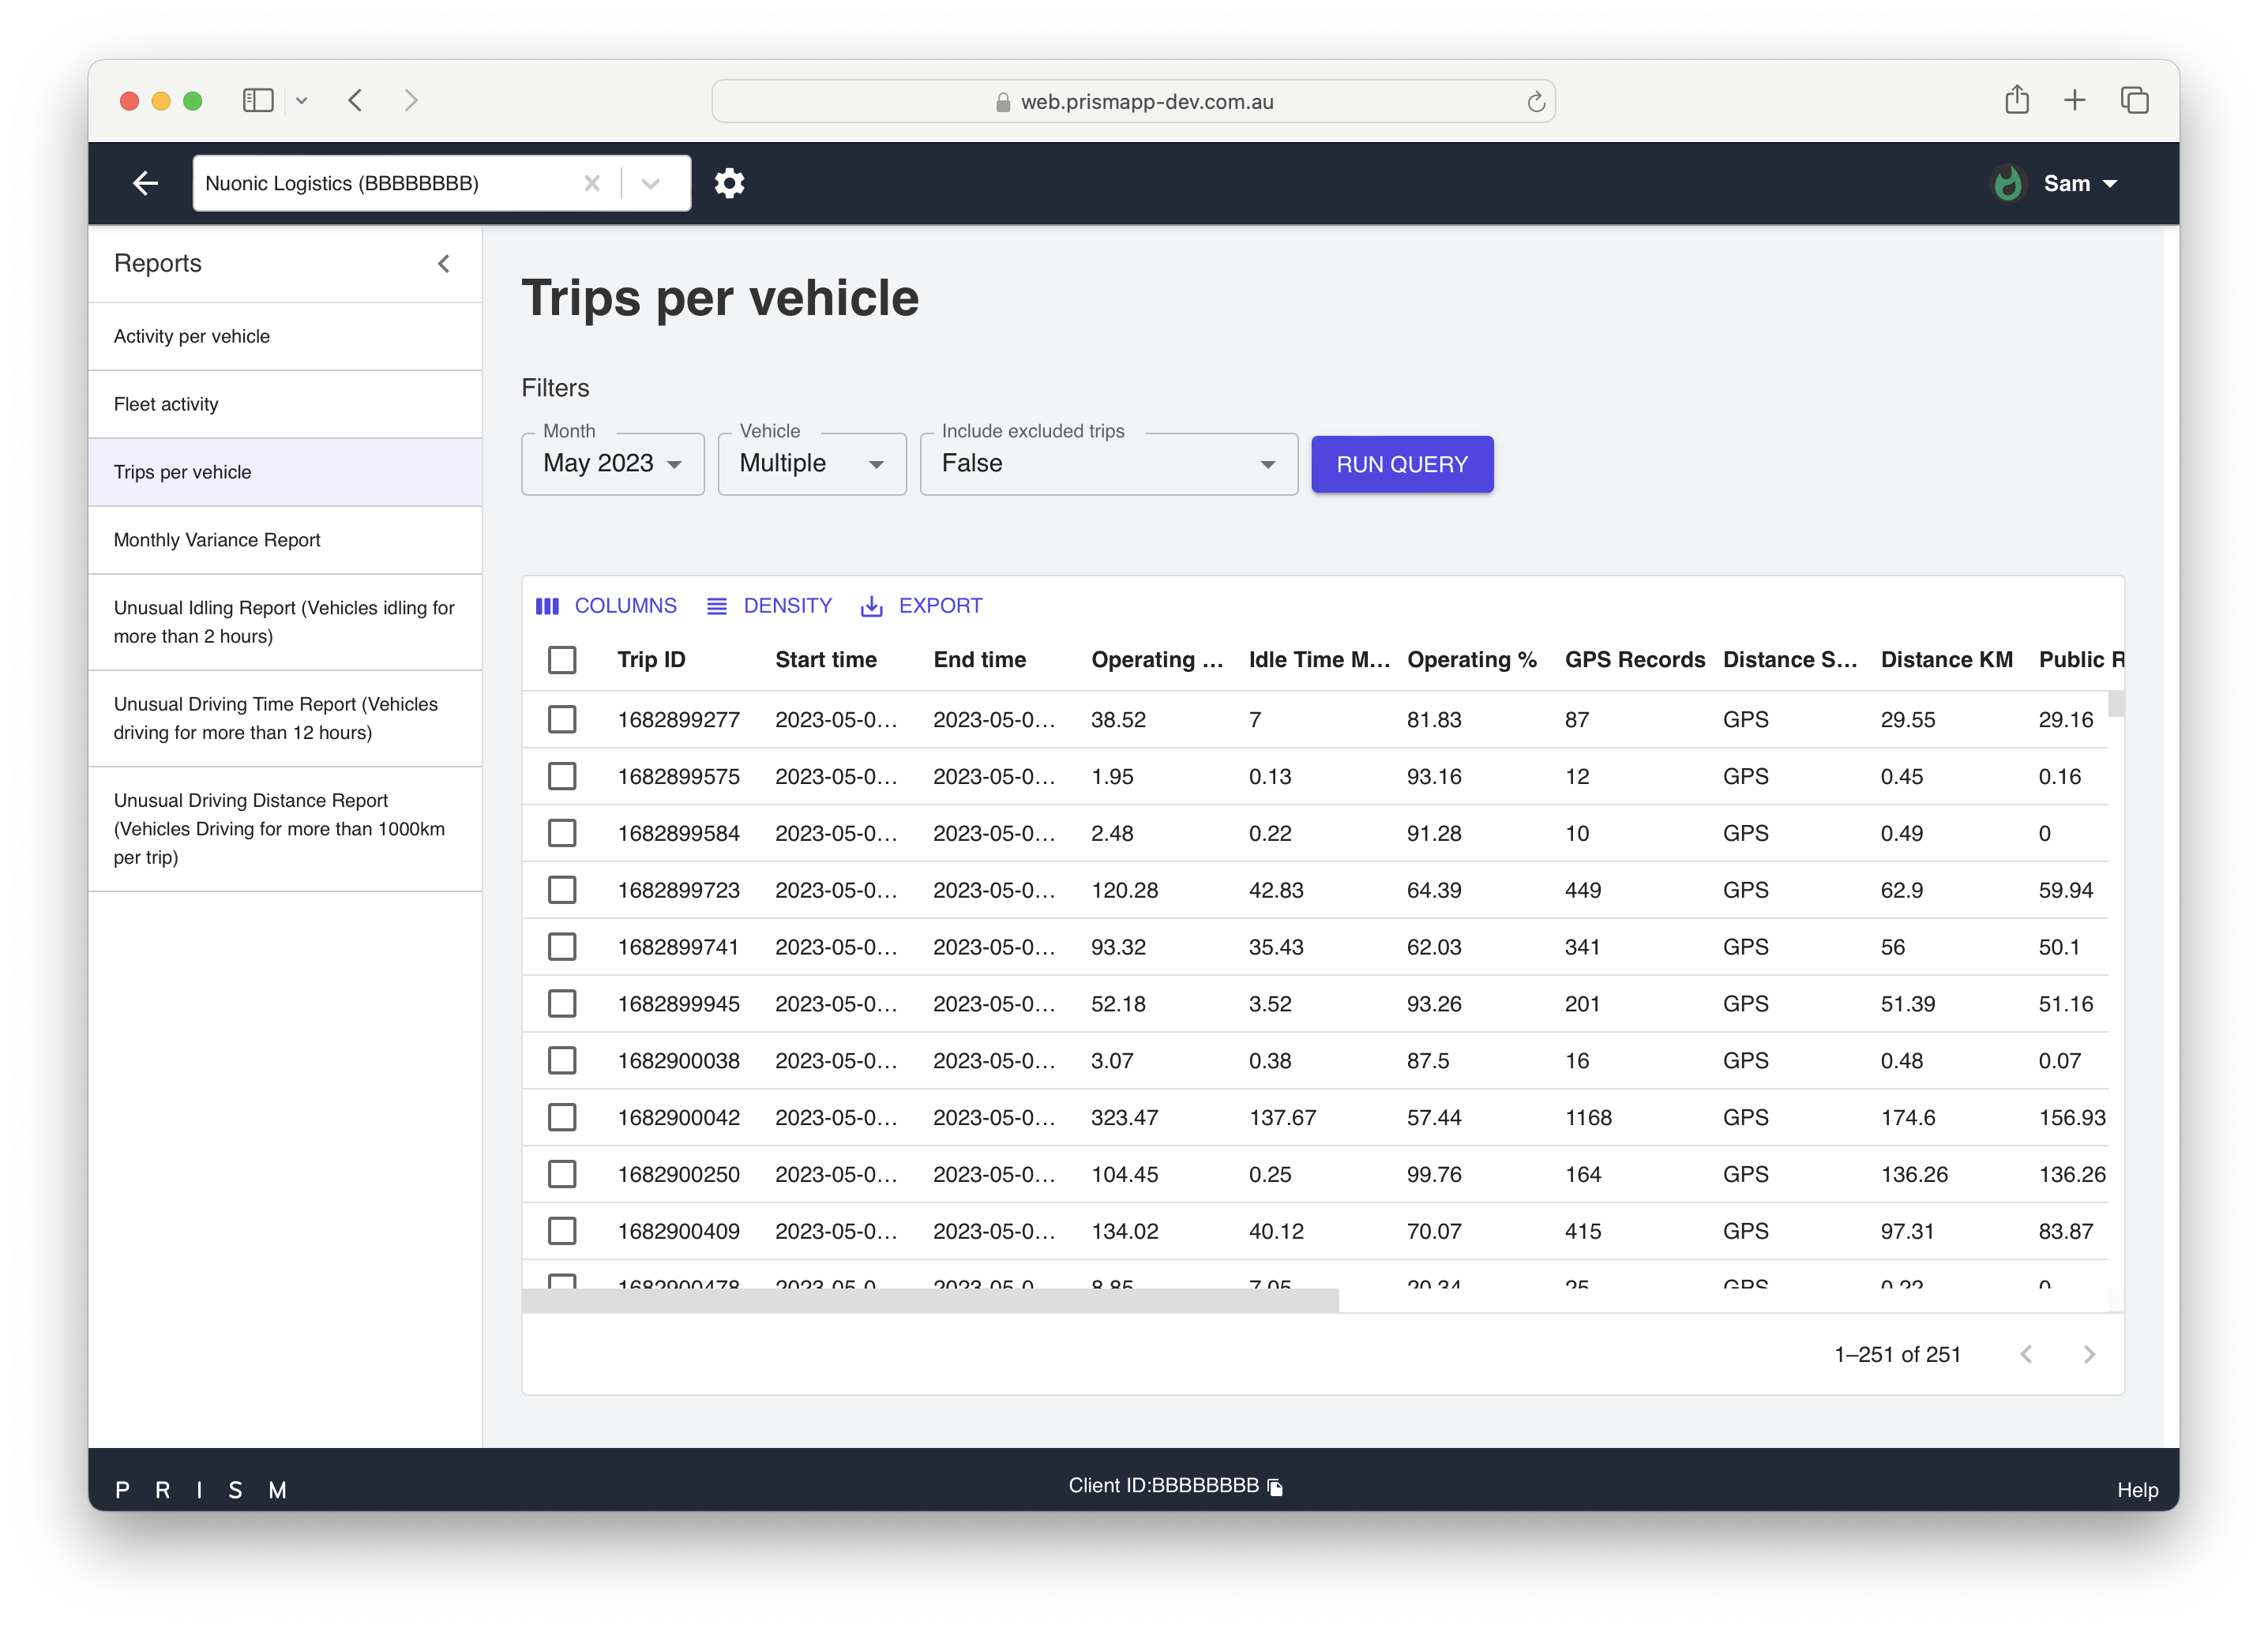
Trips per Vehicle Report:
Displays trip details for each vehicle, such as start and end times, operating and idle minutes, operating percentage, GPS records, total and public road distances, minimum and maximum speeds, and start and end locations with latitude and longitude.
Monthly Variance Report:
Compares two selected months, showing each vehicle's metrics, fuel type, registration, variance description, and percentage change. Helps identify potential anomalies in vehicle trips but does not confirm any issues.
Users have the option to filter and check the variance for the following metrics, see image below to show filters option dropdown.
Month to month comparison of total distance travelled by their fleet.
Month to month comparison of total driving time of their fleet.
Month to month comparison of total idling time of their fleet.
Month to month comparison of max vehicle speed check.
This report also allows users to filter their fleet and check
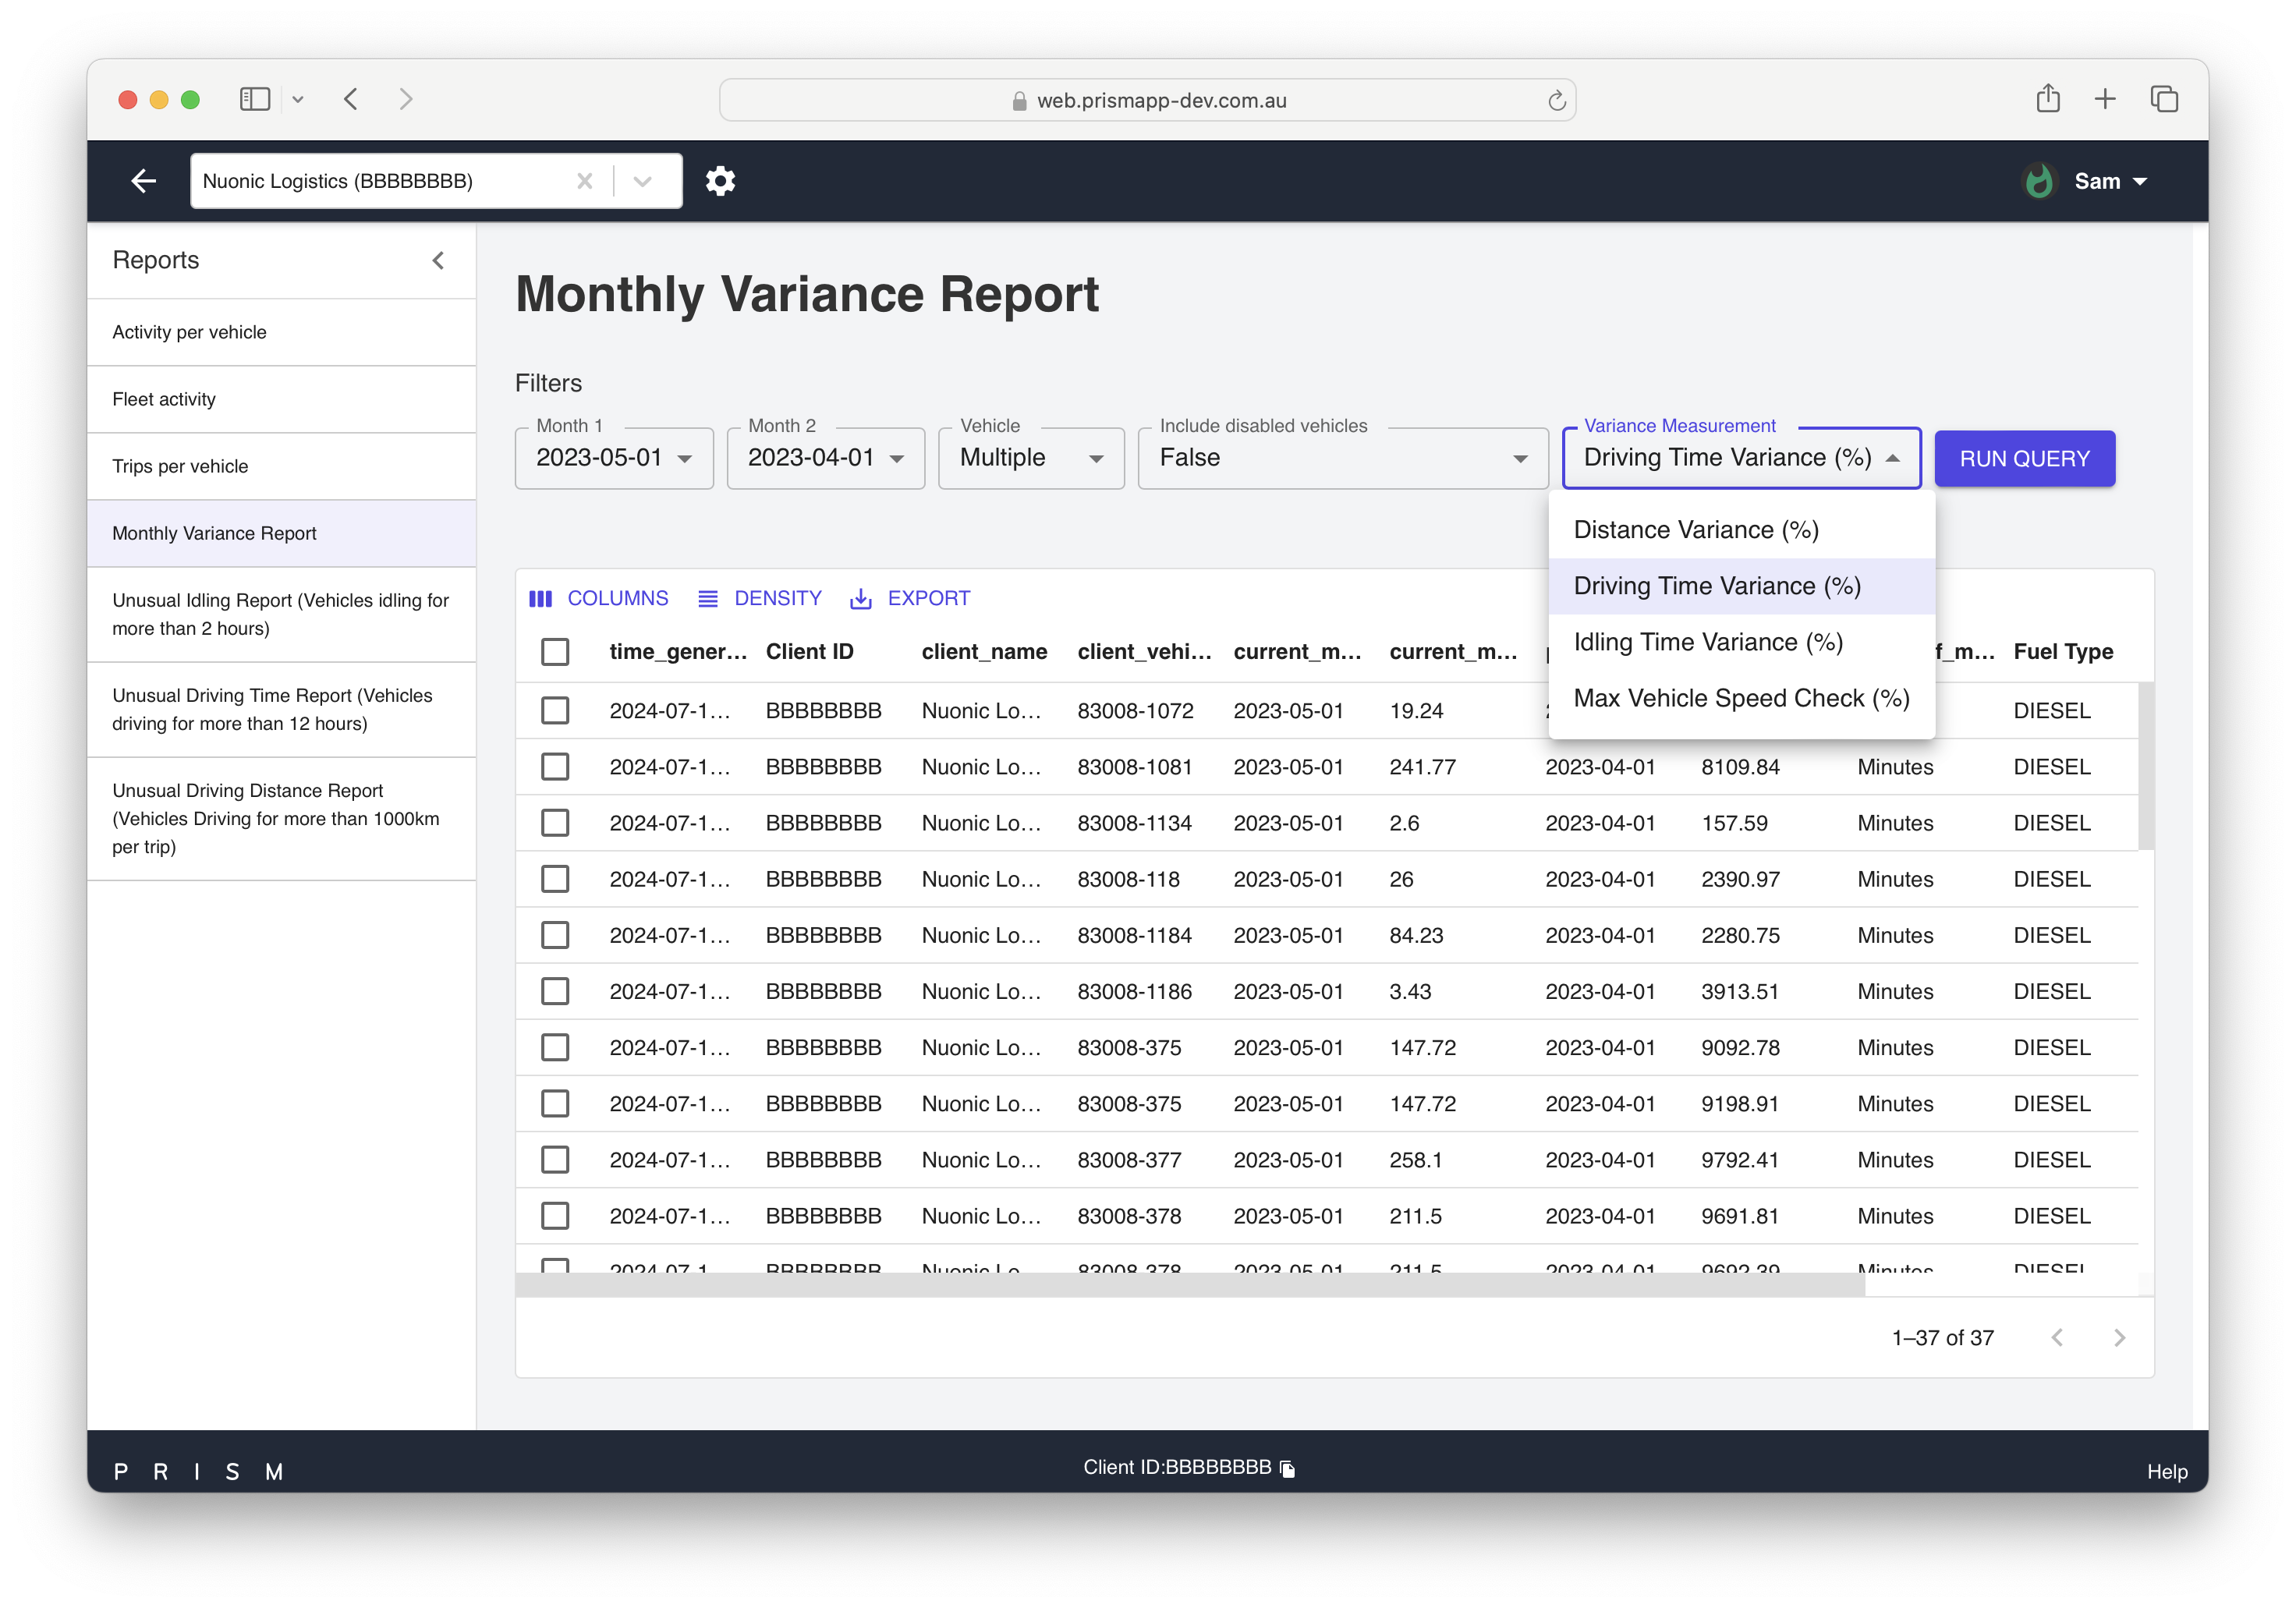
Variance reports are useful for spotting potential anomalies in vehicle trips. While they don't confirm any issues, they help identify areas for further investigation.
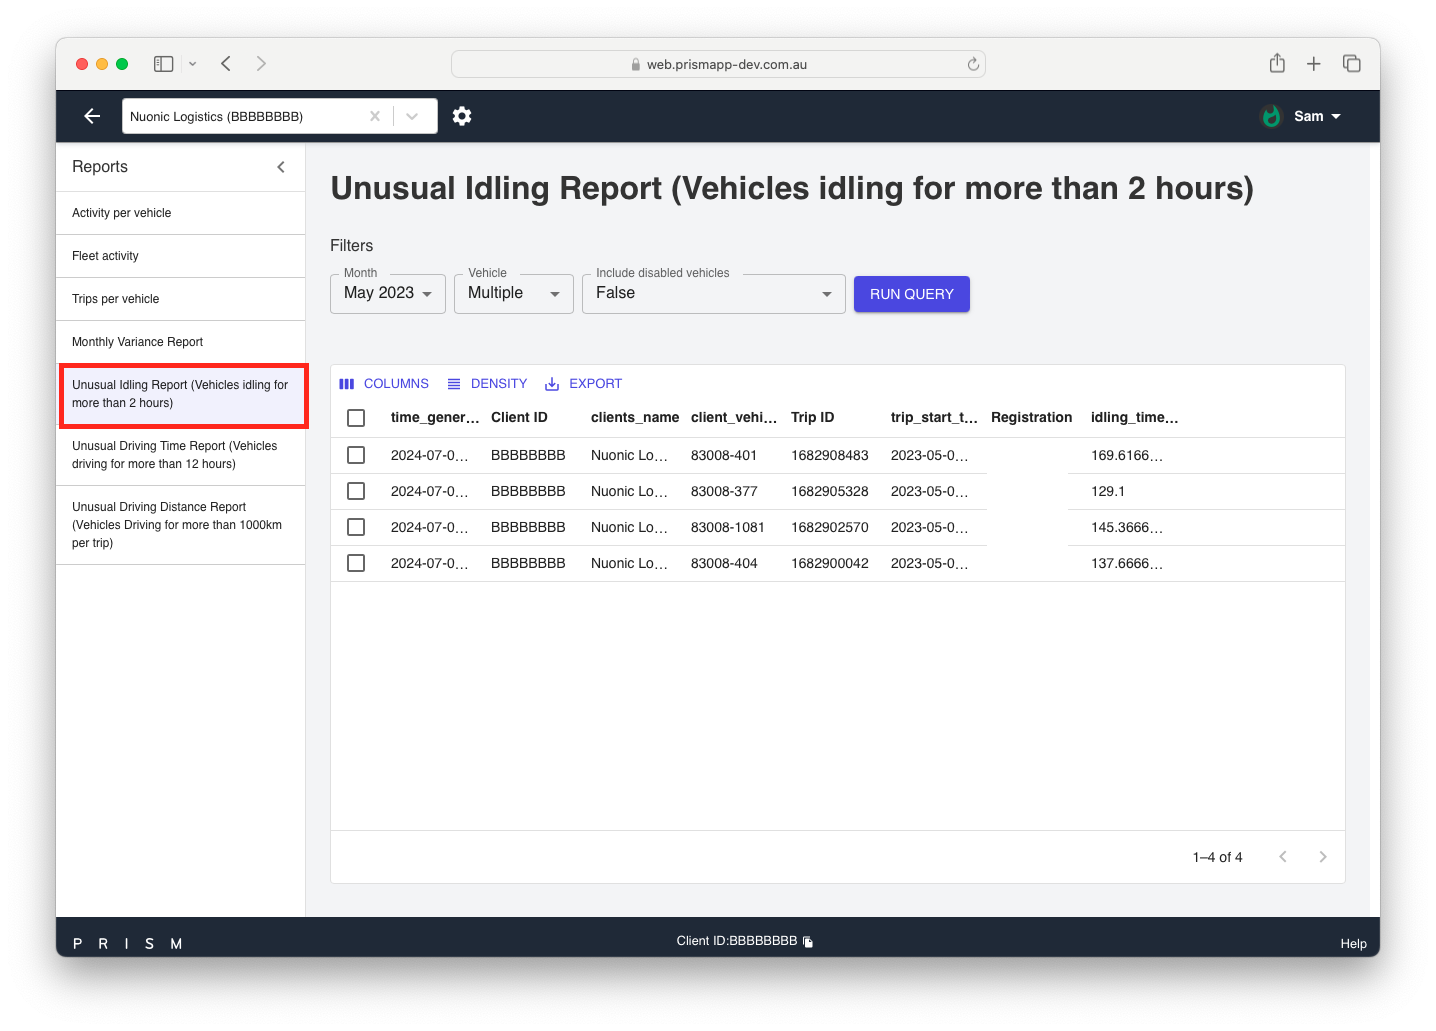
Unusual Idling Report:
These reports show vehicles that have idled for more than 2 hours (120 mins) during a trip in the selected month.
Below image is an example of what you can expect from this report
Example scenario: Nuonic Logistics is a parcel delivery company that would like to find out if there are any trips which their vehicles has recorded activity in Prism where they would like to see if any vehicles in their inventory have idled more than 2 hours per trip. The company believes they had few of their fleet at loading bays loading and unloading parcels but they want to see if there are any fleet that have consumed fuel idling during these times for a longer durations of time to try and improve vehicle maintenance aspect and also potentially improve fuel consumption.
Unusual Driving Time Report:
These reports highlight vehicles that have driven for over 12 hours on a single trip in the selected month.
Please see below for a scenario
Unusual Driving Distance Report:
Shows vehicles that recorded trips over 1000 km in distance for the selected month.