How to review off-road activity
Why is it important to review off-road activity?
Reviewing off-road activity is important because it ensures the accuracy of location and activity data. This accuracy is crucial as it can serve as evidence to the Australian Taxation Office (ATO) during audits or when submitting the Business Activity Statement (BAS) to claim Fuel Tax Credits (FTC).
Audit maps in Prism is a feature that can help with reviewing off-road and on-road vehicle activities.
What are Audit maps?
Audit maps are reports that detail high concentration of driving and idling vehicle activity on public and non-public roads. These reports help users identify mapping errors(if any) and ensure locations are captured correctly.
How do I use this tool?
To view these reports
Navigate to ‘Audit Reports’ feature in the home page of Prism web application as shown in screenshot below
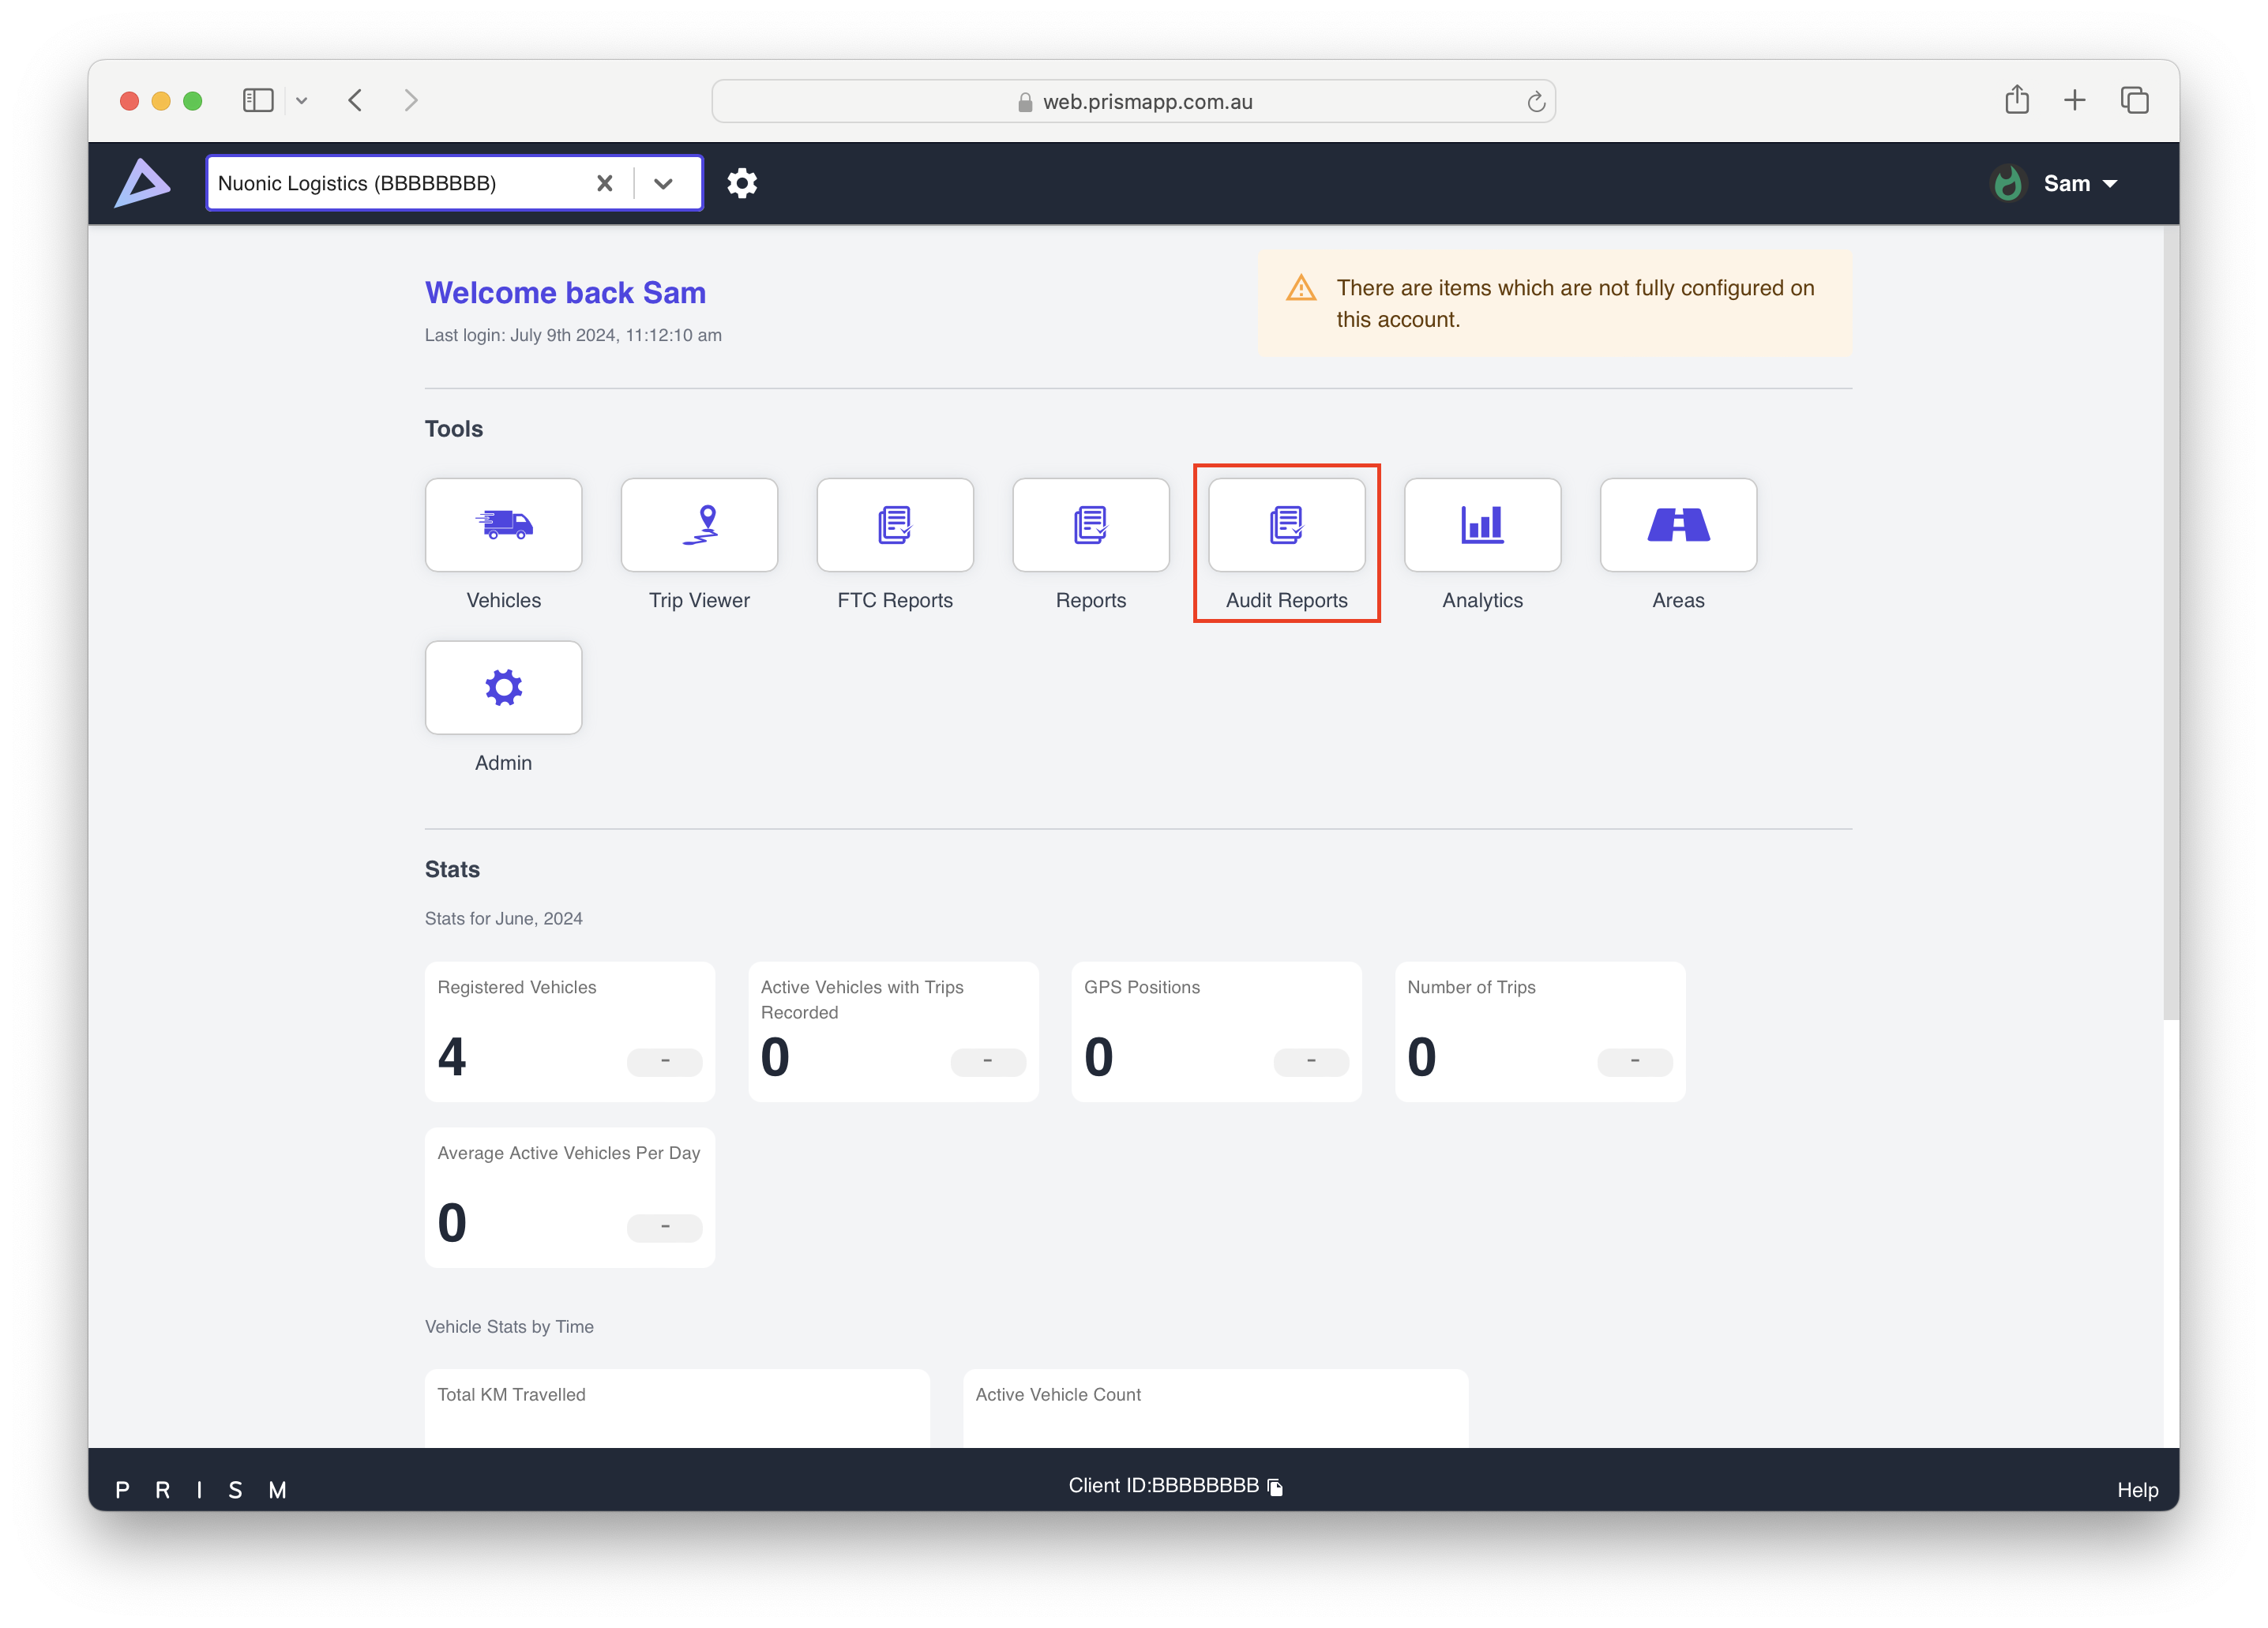
In the audit report section, you will see 8 reports
Top Non-Public Road Driving Clusters
Top Non-Public Road Idling Clusters
Top Public Road Idling Trips
Top Public Road Driving Trips
Top Non-Public Road Idling Trips
Top Non-Public Road Driving Trips
Audit trip file
Audit analysis tables
Note: If you do not see any reports in this section, you can generate the reports for the month of your choice by selecting the '![]() ' option at the top right-hand side of your screen, as shown in the screenshot below. If there are still any concerns, reach out to us at 📧 Nuonic E-mail Support or 📲 Call Nuonic Support.
' option at the top right-hand side of your screen, as shown in the screenshot below. If there are still any concerns, reach out to us at 📧 Nuonic E-mail Support or 📲 Call Nuonic Support.
Generating new Audit Reports (per month)
What do these reports mean and what should I understand from each of these reports?
Top Non-Public Road Driving Clusters
These reports highlight clusters of high non-public road driving activity in specific regions.
When you open the document, navigate to:
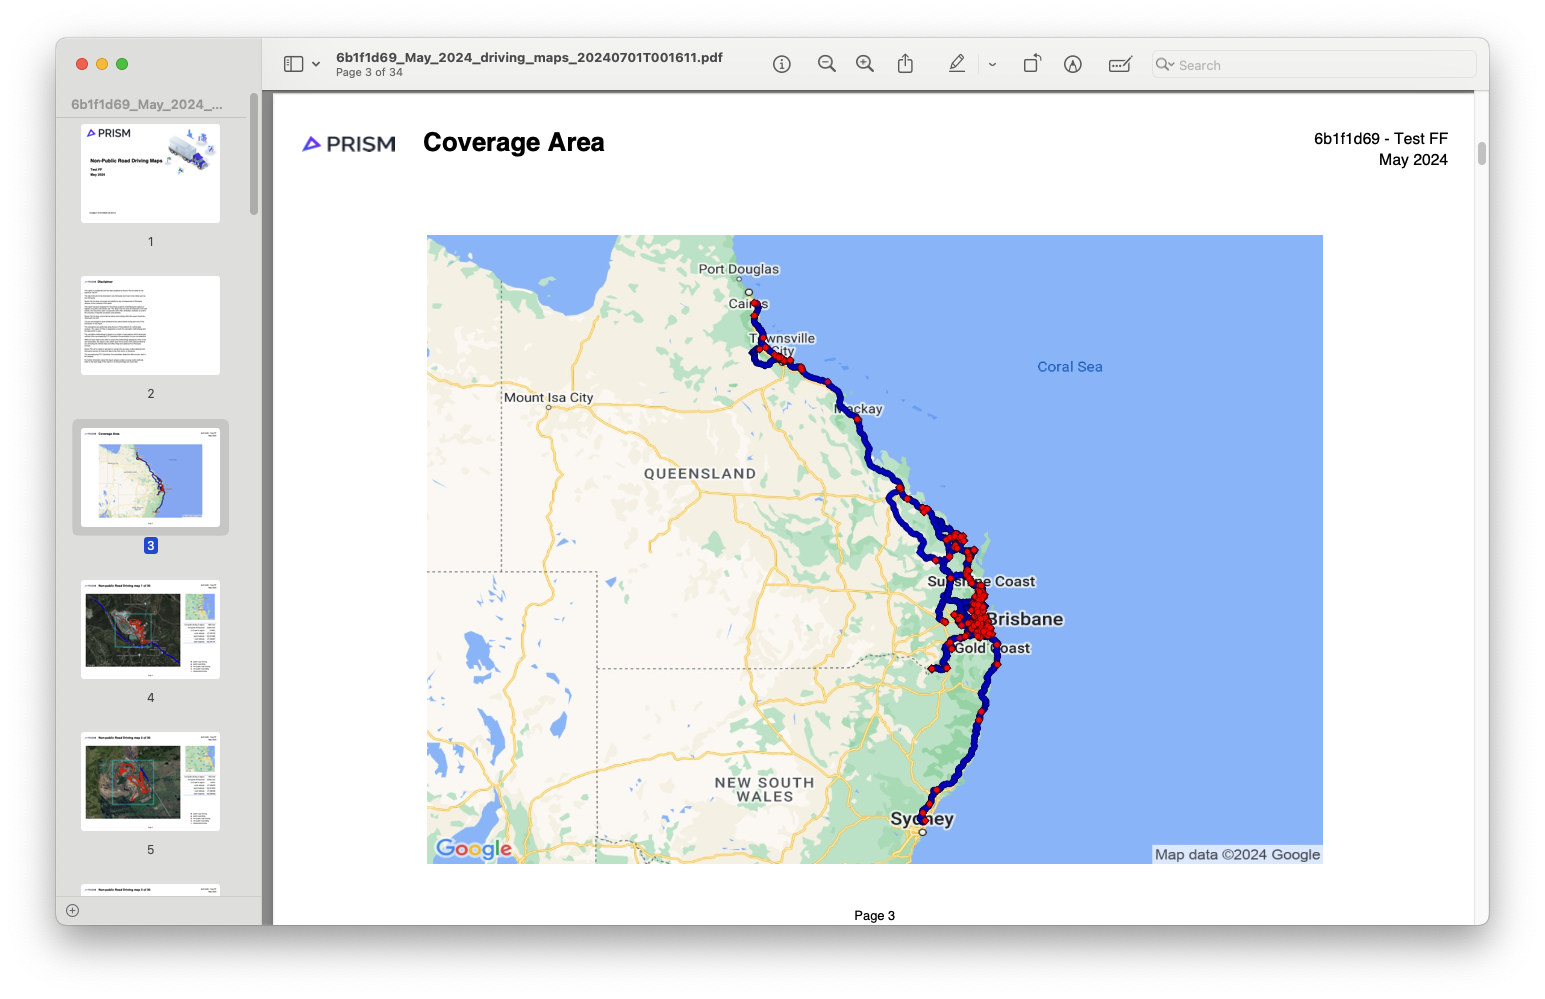
Page 3: Shows the entire fleet's coverage area across the country.
Page 4 - Following Page: These pages show details of vehicle activity with the highest non-public clusters. There are sections in page which aid in understand the exact locations where Non-Public activities are concentrated.
Below is an explanation of the sections for these pages.
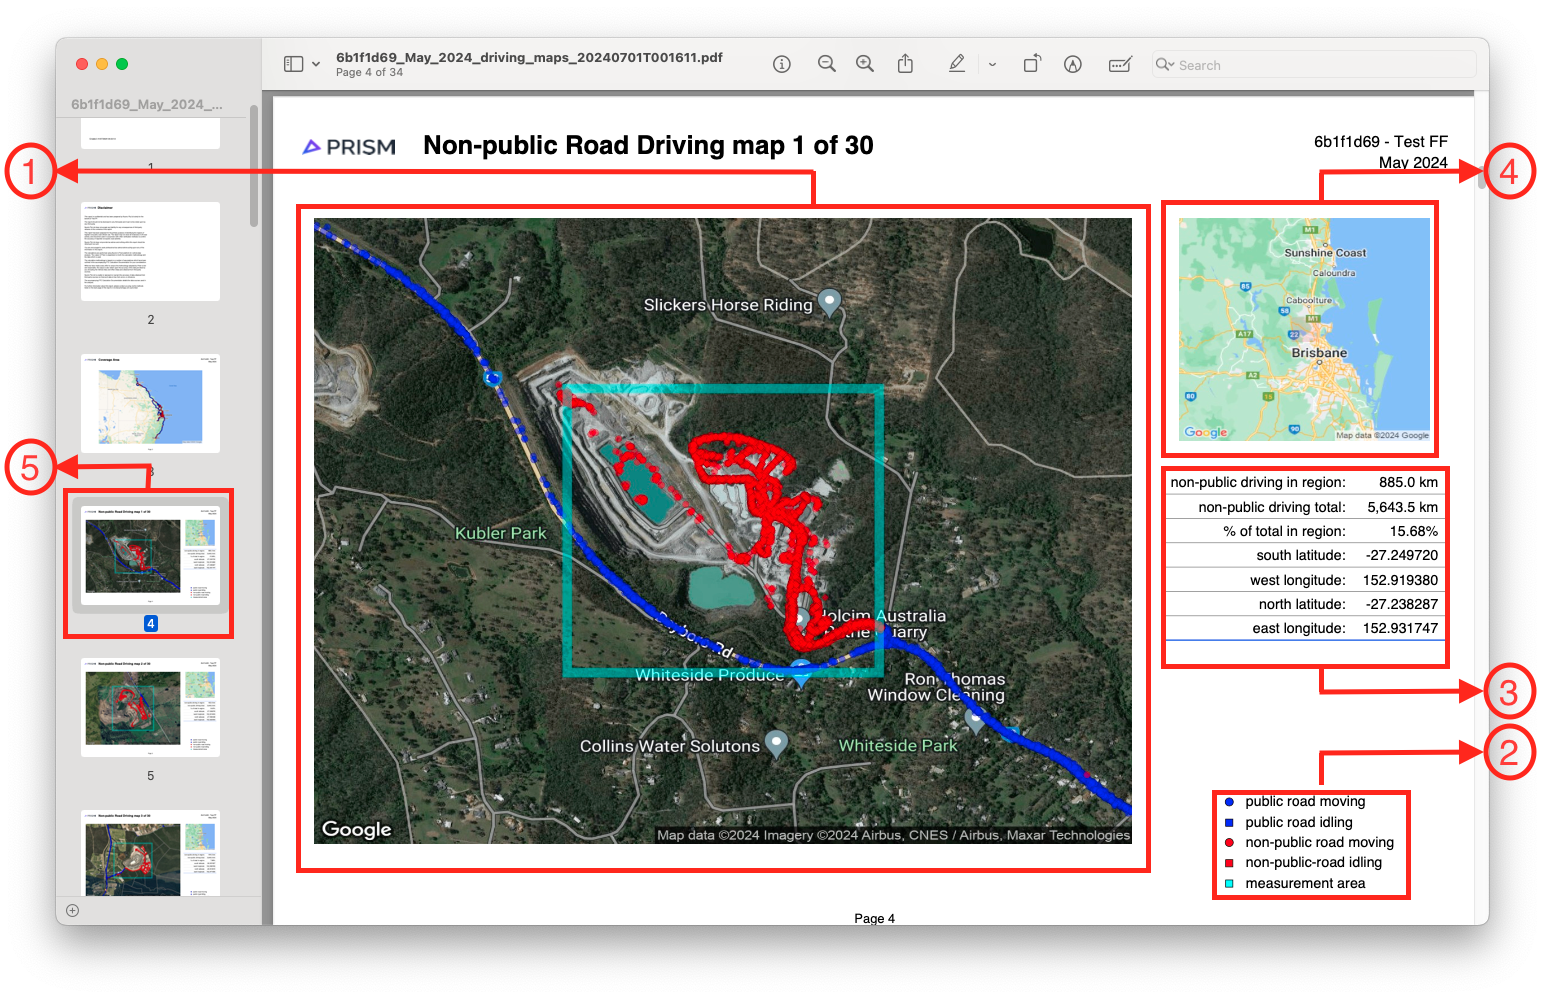
Section 1: This section shows the concentration of non-public vehicle activity in a specific area. Red clusters indicate non-public GPS points or vehicle activity, based on vehicle trip data.
Section 2: This section explains the references from Section 1 and what the different colour clusters represent.
Section 3: Displays statistics from the compiled data. Pay attention to the location stats and non-public percentage. It also includes the total non-public distance for comparison with overall non-public stats.
Section 4: Click this link to open Google Maps to the exact location mentioned in Section 1. It helps if you want to view the location in detail.
Section 5: Here, you can scroll through different pages containing the sections above. Review these to clarify doubts and check mapping and road classification accuracy.
Note - The accuracy of Audit Reports depends on both the methodology used by Prism and the data provided by you, including vehicle data and data from third-party sources. The accuracy of the data depends primarily on the providers' data and the provision of actual fuel data. Manual fuel consumption data is generally more accurate compared to estimated fuel figures.