How to access and use FTC reports
In this user guide, we will walk you through the following:
About FTC Reports
Accessing Prism Reports
Understanding Prism Reports
Adding and Generating Reports
About FTC Reports
If you are on a monthly subscription, your reports will be emailed to the nominated FTC Report delivery recipients on the 5th (or thereabouts) of each month. To check or change your report recipients, visit the Understanding the Prism Settings page on how to do this (starting from Feature 2 - Adding Email Address(es).
All reports (current and retrospective) are saved and accessible via the Prism Web App.
Accessing Prism Reports
All reports (current and retrospective) are saved and easily accessibly via the Prism Web App, which can be accessed via https://web.prismapp.com.au/ if you already have an account created.
To access your reports, follow these steps below along with accompanying screenshots.
Step 1: Go to https://web.prismapp.com.au/, and login using your email address and password (if you already have an account created). Afterwards, select SIGN IN:
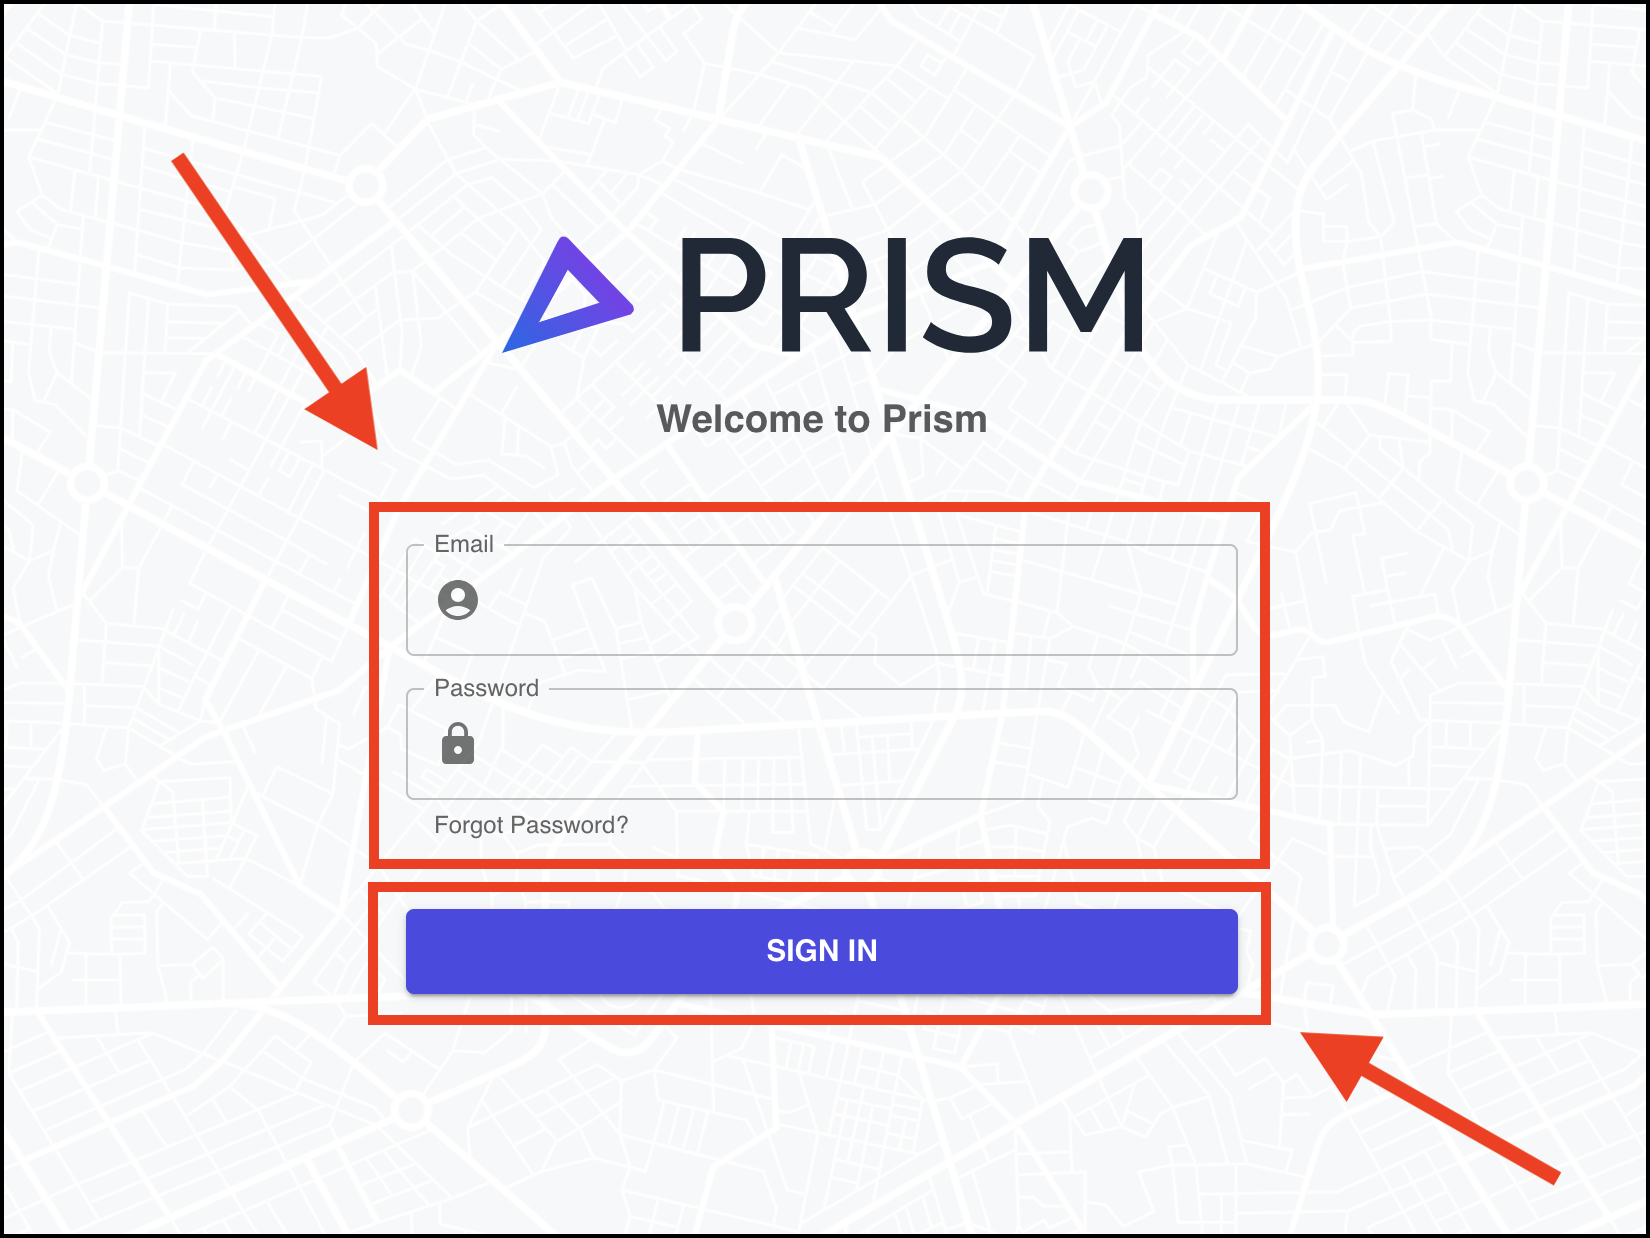
Screenshot 1 - Sign In
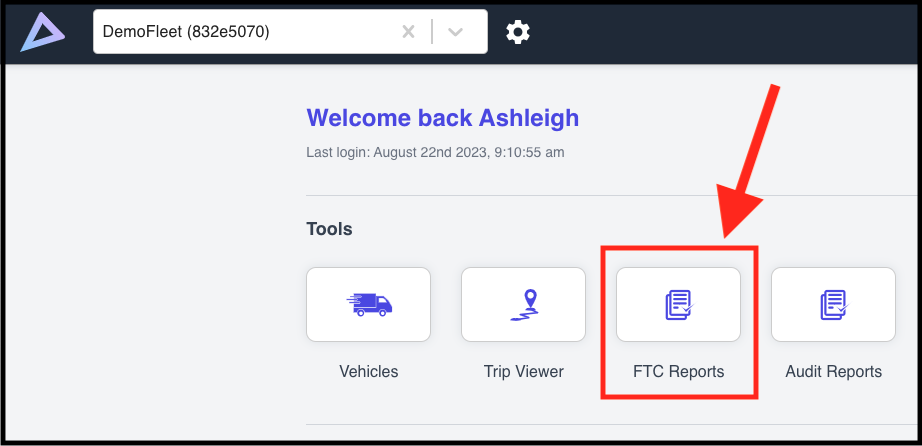
Step 2: From the home page, select FTC Reports.
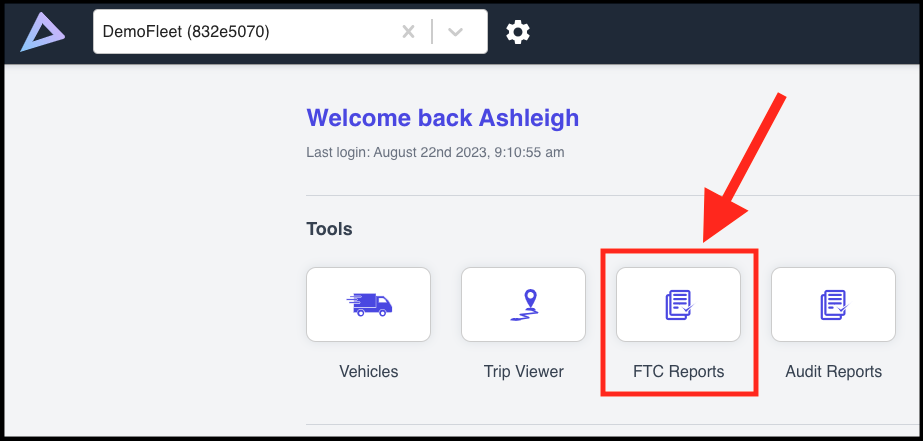
Screenshot 2 - FTC Reports Feature
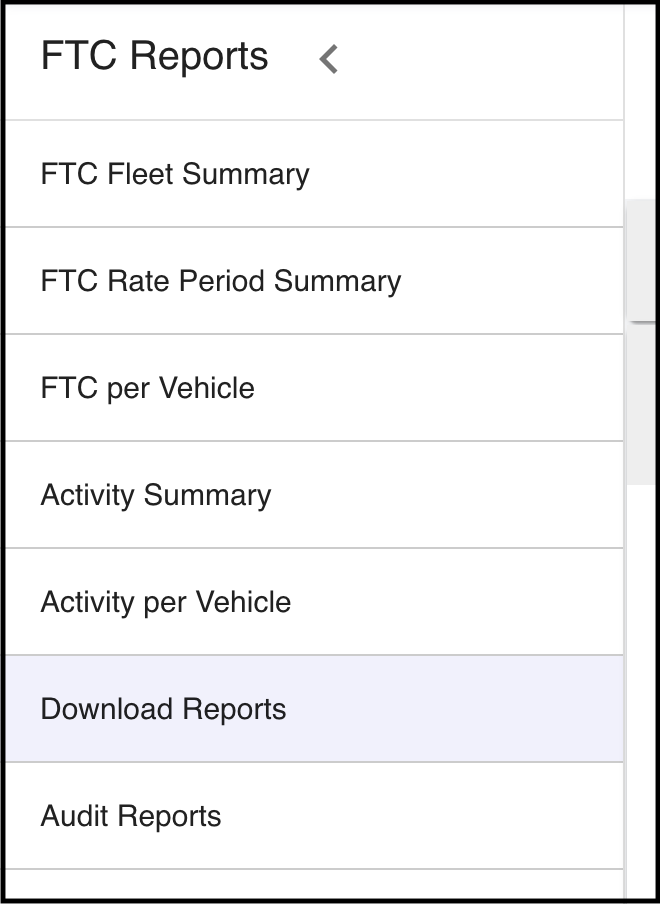
From here, you will now be in the FTC Reports feature which looks like this (Screenshot 3 - FTC Reports Page). We will go into depth about each of it’s options (ie. FTC Fleet Summary, Download Reports etc), further in this user guide.
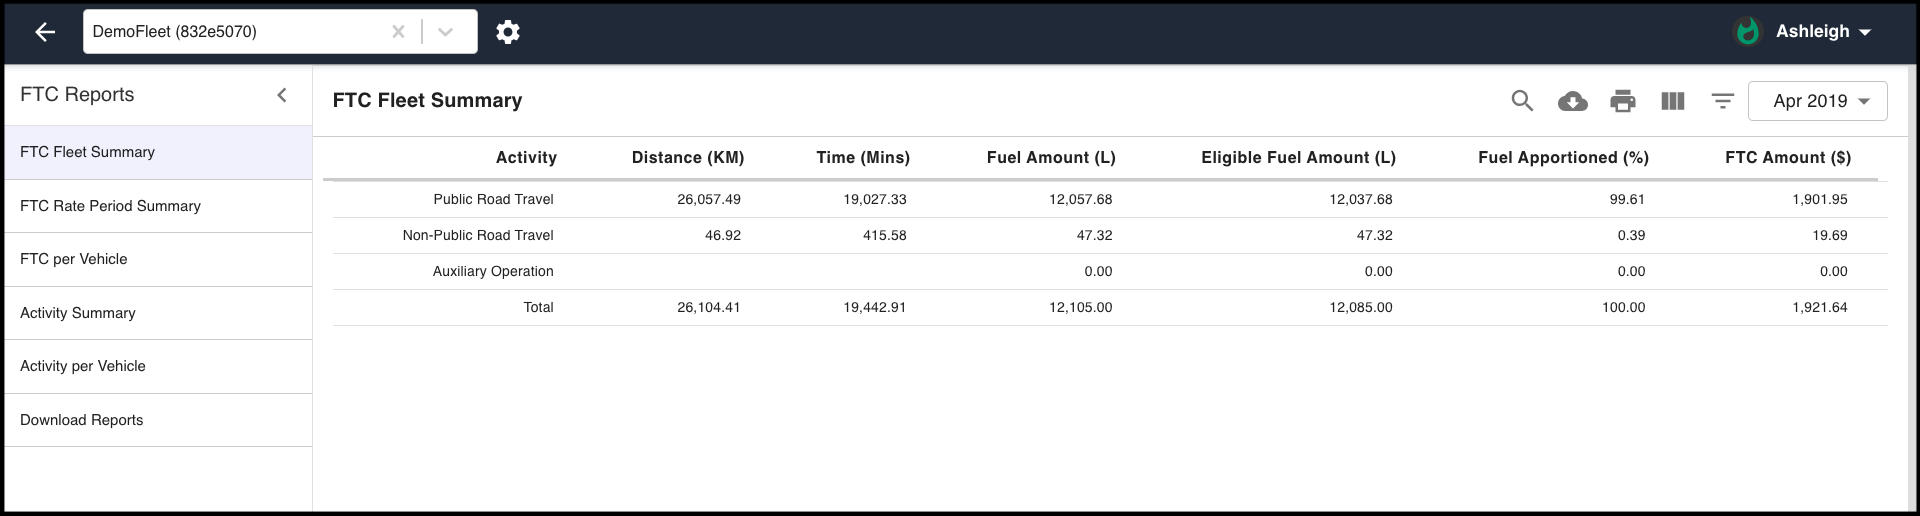
Screenshot 3 - FTC Reports Page
Step 3: Select Download Reports, where you will now be in the section to be able to not only view reports, but also download and (re-)generate reports:
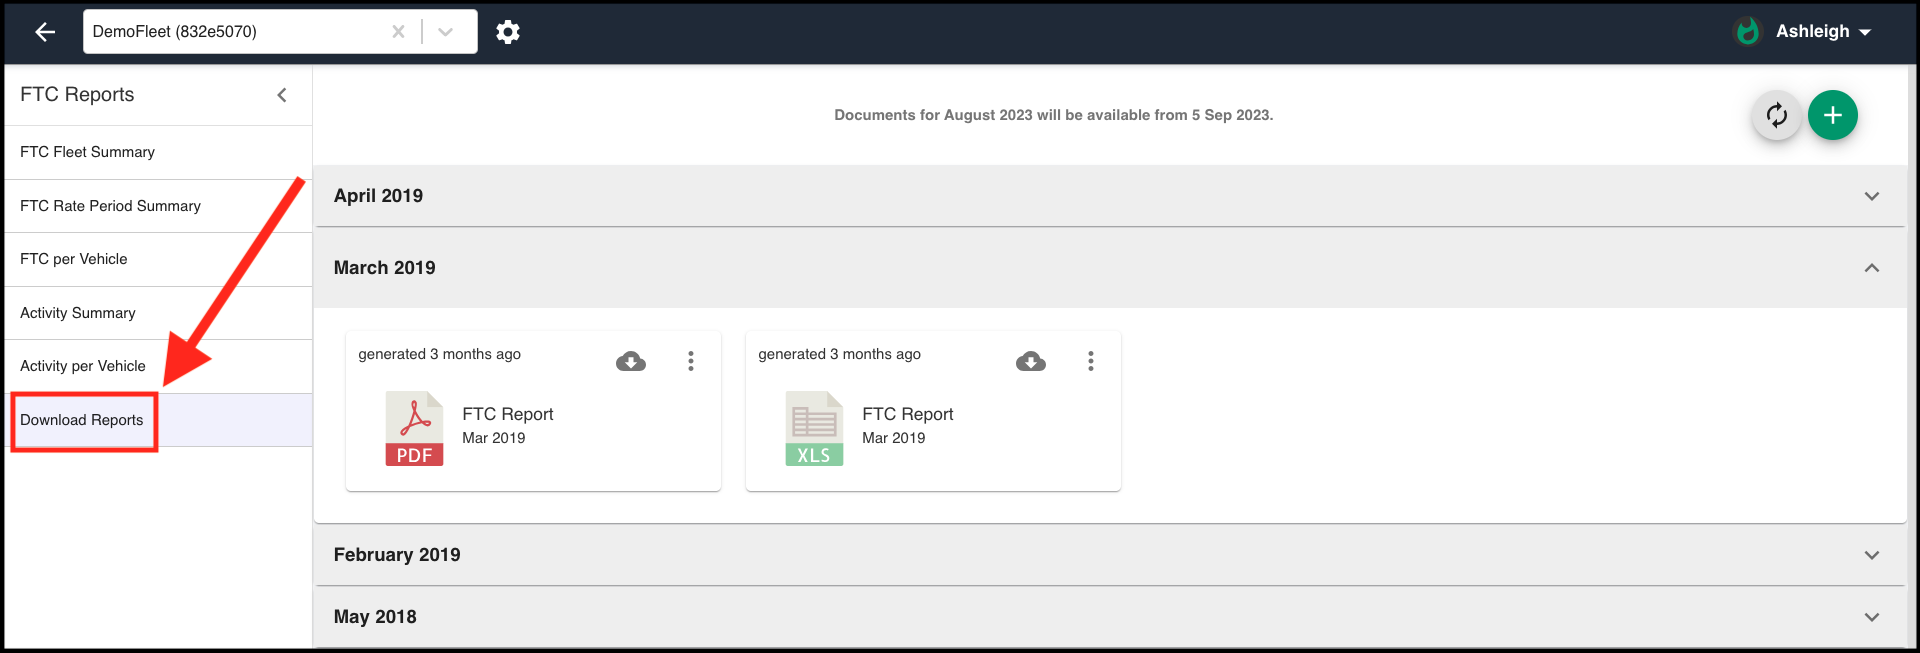
Screenshot 4 - Download Reports Homepage
Let’s now look over the options available to you in the Download Reports dashboard:
Option 1 - Real Time Reporting Information
Screenshot 5 - Real Time Reporting Information
Whilst the downloaded reports are static (ie. only changing when you regenerate them), these reporting sections are dynamic and are updated as soon as changes are made/data is received.
You’ll be able to click on each section to see a real time display of reporting information displayed by month. We will go into detail about each of them further in this user guide.
Option 2 - Data Availability of New Reports
You can see the current month’s partial data in the real time reporting section. However, you cannot generate and download the monthly reports until after the month has concluded, and the data has been consolidated for that month.
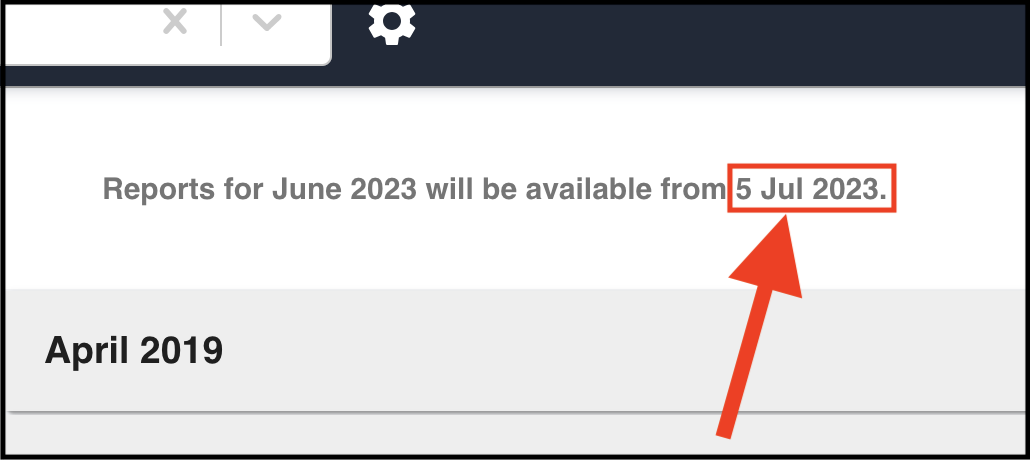
Screenshot 6 - Data Availability of New Reports
Option 3 - Adding Reports
You can add a report (in both PDF and Excel) for any month that Prism has processed the data for.
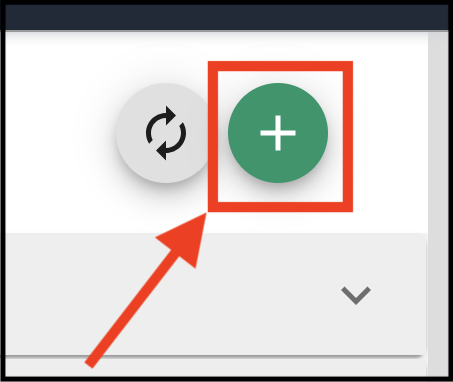
Screenshot 7 - Adding Reports
Option 4 - Monthly Reports
You will be able to click to expand each month to see the reports that have been generated.
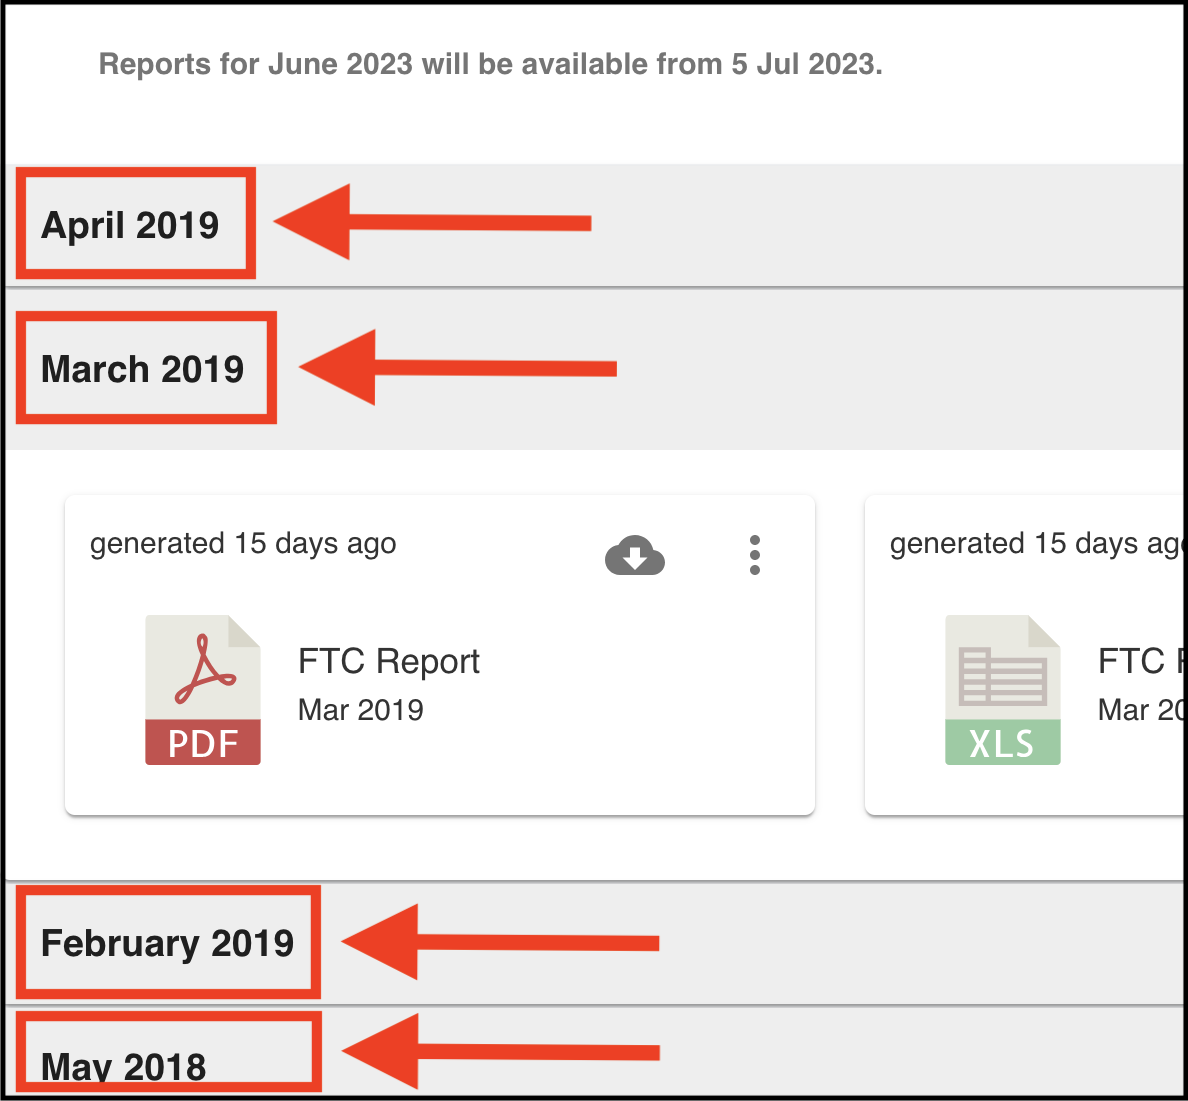
Screenshot 8 - Monthly Reports
Option 5 - Date of Last Generated Report
This data will tell you how long ago since the report was last generated.
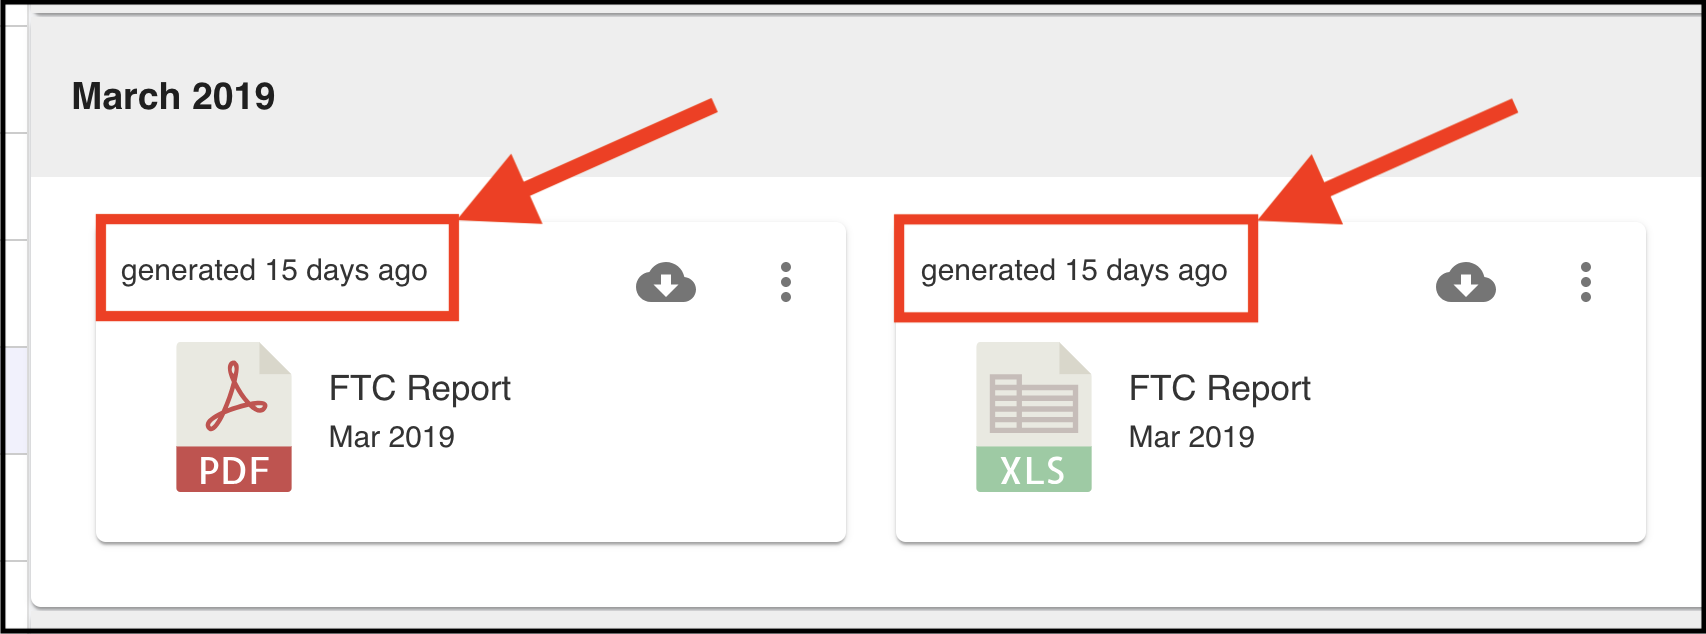
Screenshot 9 - Date of Last Generated Report
Option 6 - Downloading Reports
By clicking on the cloud icon, you will be able to download the reports.
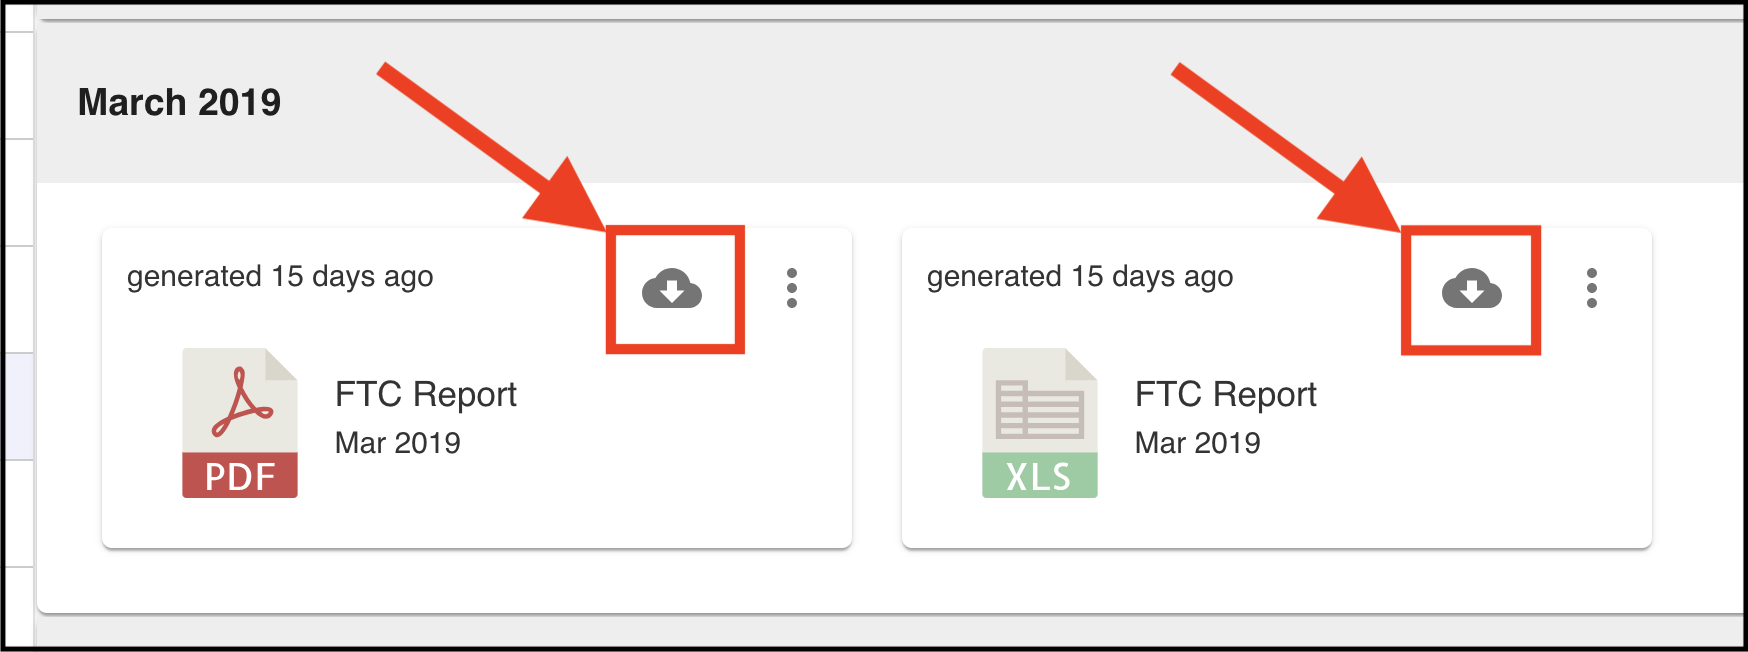
Screenshot 10 - Downloading Reports
Option 7 - Regenerating and Emailing Reports
When you click on the three dots, you have the option to either email the reports or regenerate the reports.
You may use the 'regenerate your report' option for a number of reasons. The most common you would need to regenerate the reports would be:
There has been new data for that month added; and/or
You have made updates to your vehicle register; and/or
You have made updates to your fuel register.
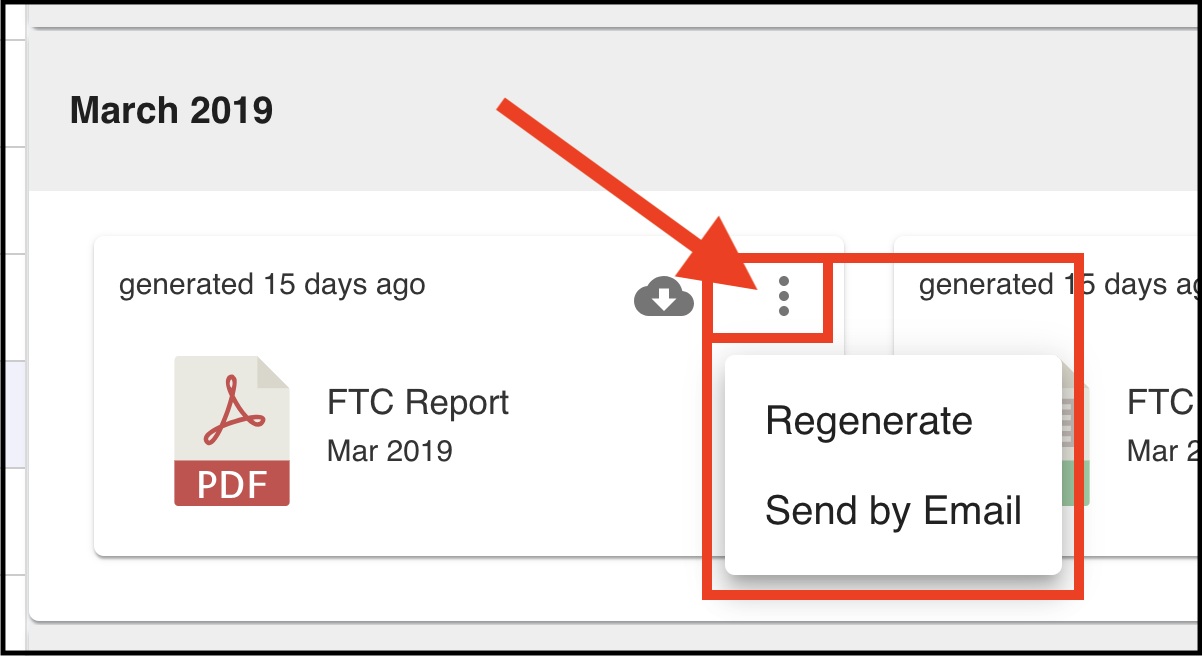
Screenshot 11 - Regenerating and Emailing Reports
Understanding Prism Reports
Reporting in Prism is made easy through the intuitive portal and report summaries outlined below, through the homepage of FTC Reports (as per Screenshot 3 - FTC Reports Page) and below in Screenshot 12 - FTC Reports Features.
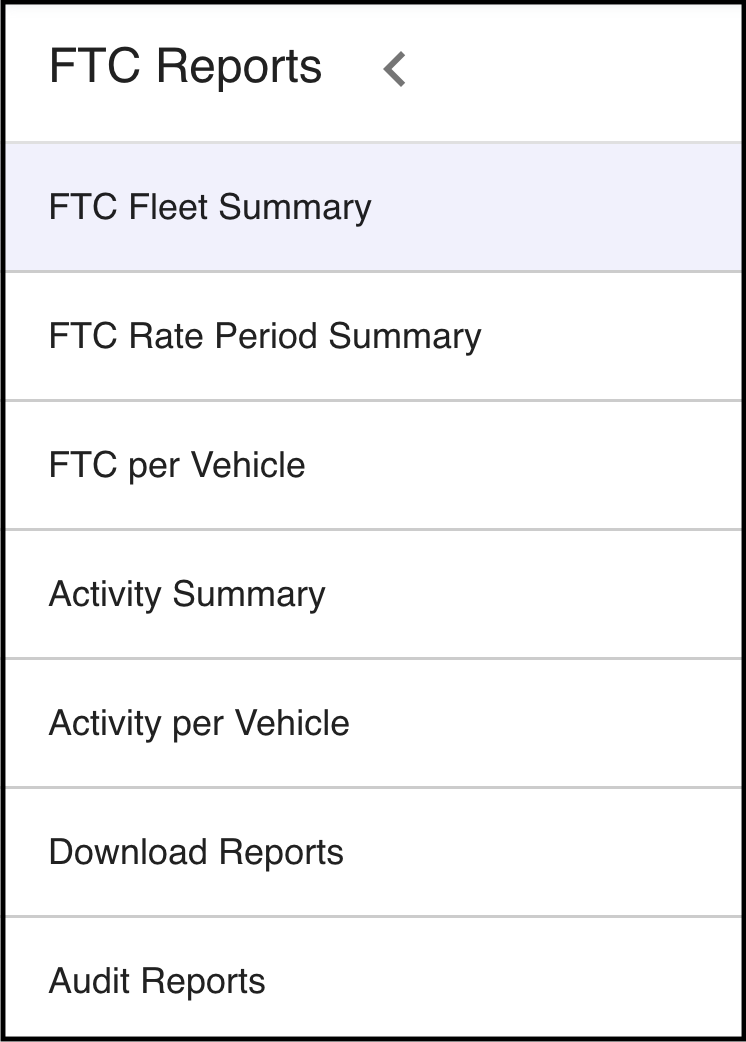
Screenshot 12 - FTC Reports Features
FTC Fleet Summary
This displays a summary of the fuel used for the chosen reporting period, in addition to the fuel apportioned to on-road and off-road activity, the total eligible claim amount ($), as well as fuel eligible for claim.
FTC Rate Period Summary
This displays a summary of fuel used in the reporting period, and information on the FTC per vehicle per month displays detailed FTC and fuel intake information against each vehicle in your fleet.
FTC per Vehicle
This displays the detailed FTC and fuel intake information against each vehicle in your fleet.
Activity Summary
This displays the total activity summary on the chosen month.
Activity per Vehicle
This displays a fleet view of proportions for off-road and on-road fleet usage.
Download Reports
In this section, you can access all of your already-produced reports. You will also see a list of all of the months for which there are FTC reports available. To access the reports for a given month:
Click on the month you wish to view, and a drop-down will appear giving you the option to access the report in either PDF or Excel.
To download the report, click the Download icon (cloud icon) of the report that you would like to download. From here, this will prompt the file to commence downloading to your computer.
Audit Reports
Prism provides customers with raw data files and audit maps to assist with any questions that the ATO may have in regards to the calculations performed using your data.
To access the Audit Reports, you will need to contact support@nuonic.com.au to have this function enabled in your account:
Once enabled and from the Prism homepage, select FTC Reports from the Tools section.
Under FTC Reports, select the ‘Audit Reports’ tab at the bottom of the left-hand side pane.
Click on the month that you wish to access Audit Reports. A drop-down will appear giving you the option to access.
Adding and Generating Reports
Step 1: Click on FTC Reports from the Prism homepage to enter the reports section:
Screenshot 13 - FTC Reports
Step 2: Select Download Reports, where from there you will click on the green plus sign:
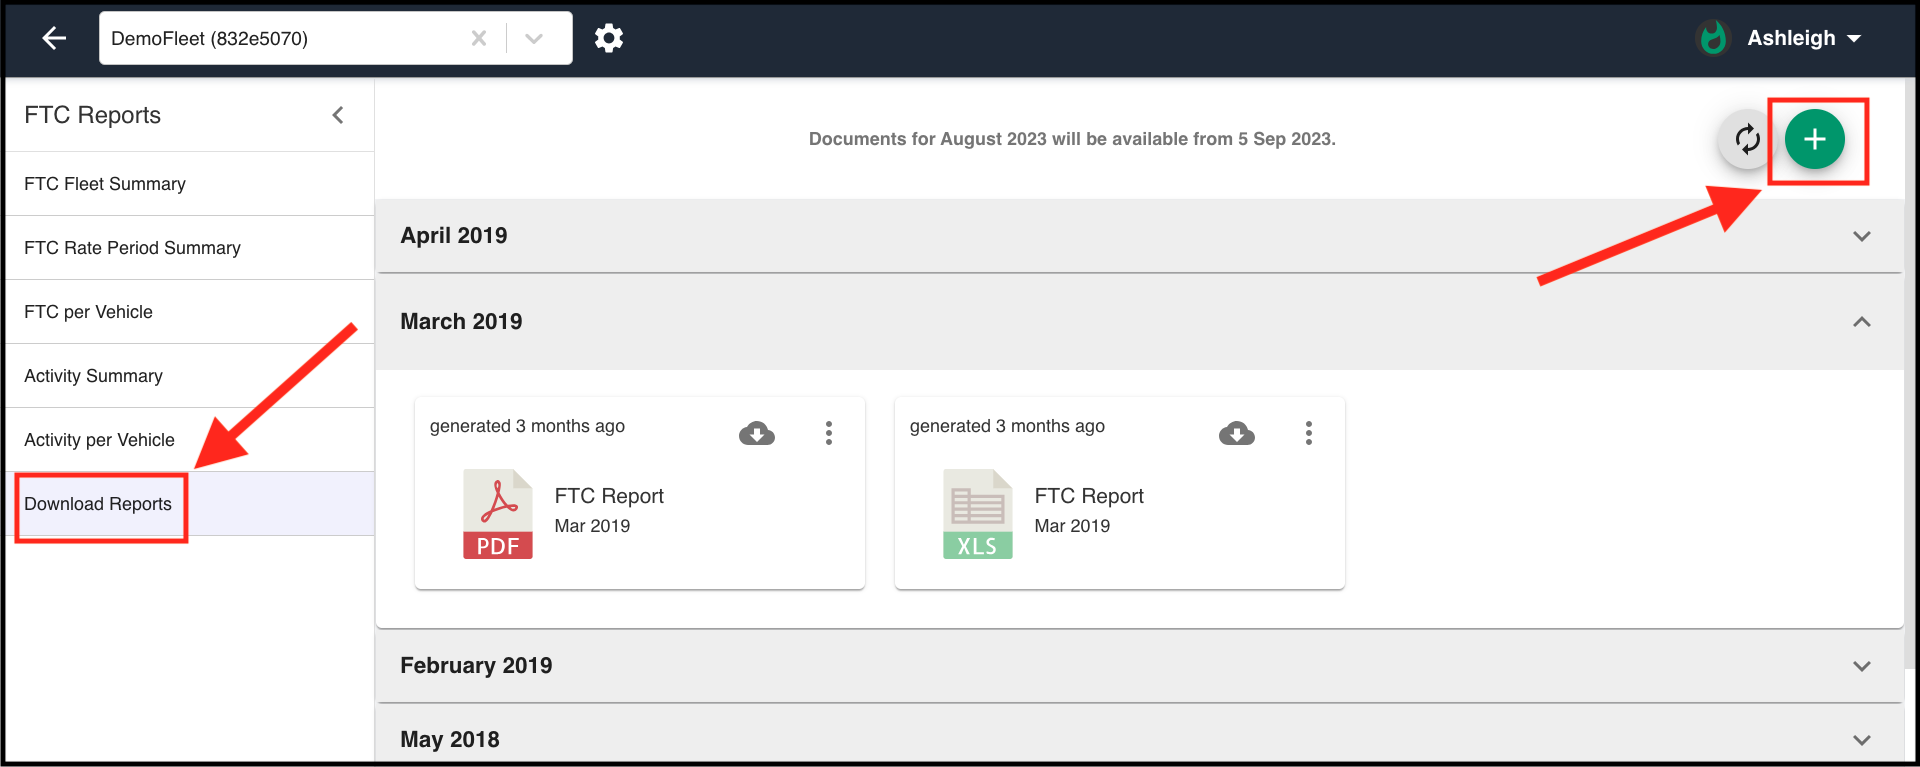
Screenshot 14 - Download Reports
Step 3: When you click on the green plus sign, this will display a new window with options for creating a new report. This is completed by:
Choosing a time period for your report by the month;
Choosing to create the report in either PDF and/or Excel;
Advanced report selection, which allows users to report on multiple months
Once you press Continue, please ensure you click on the Refresh button (next to the green plus sign), in order for your report to appear:
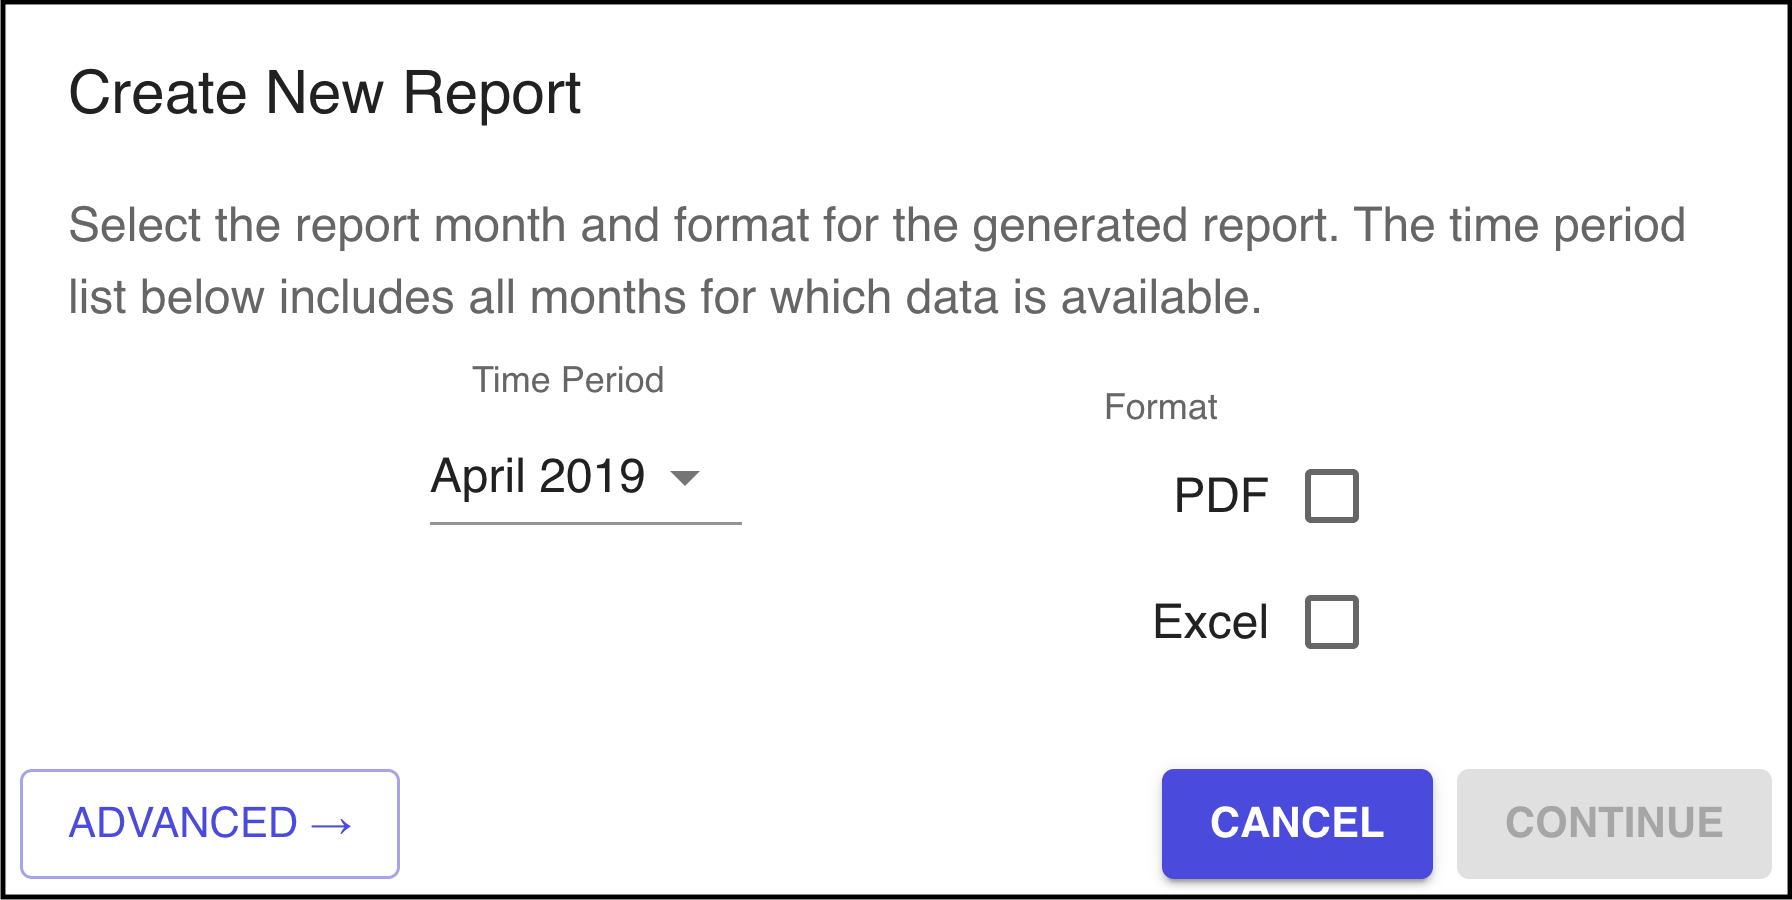
Screenshot 15 - Creating New Report (Basic)
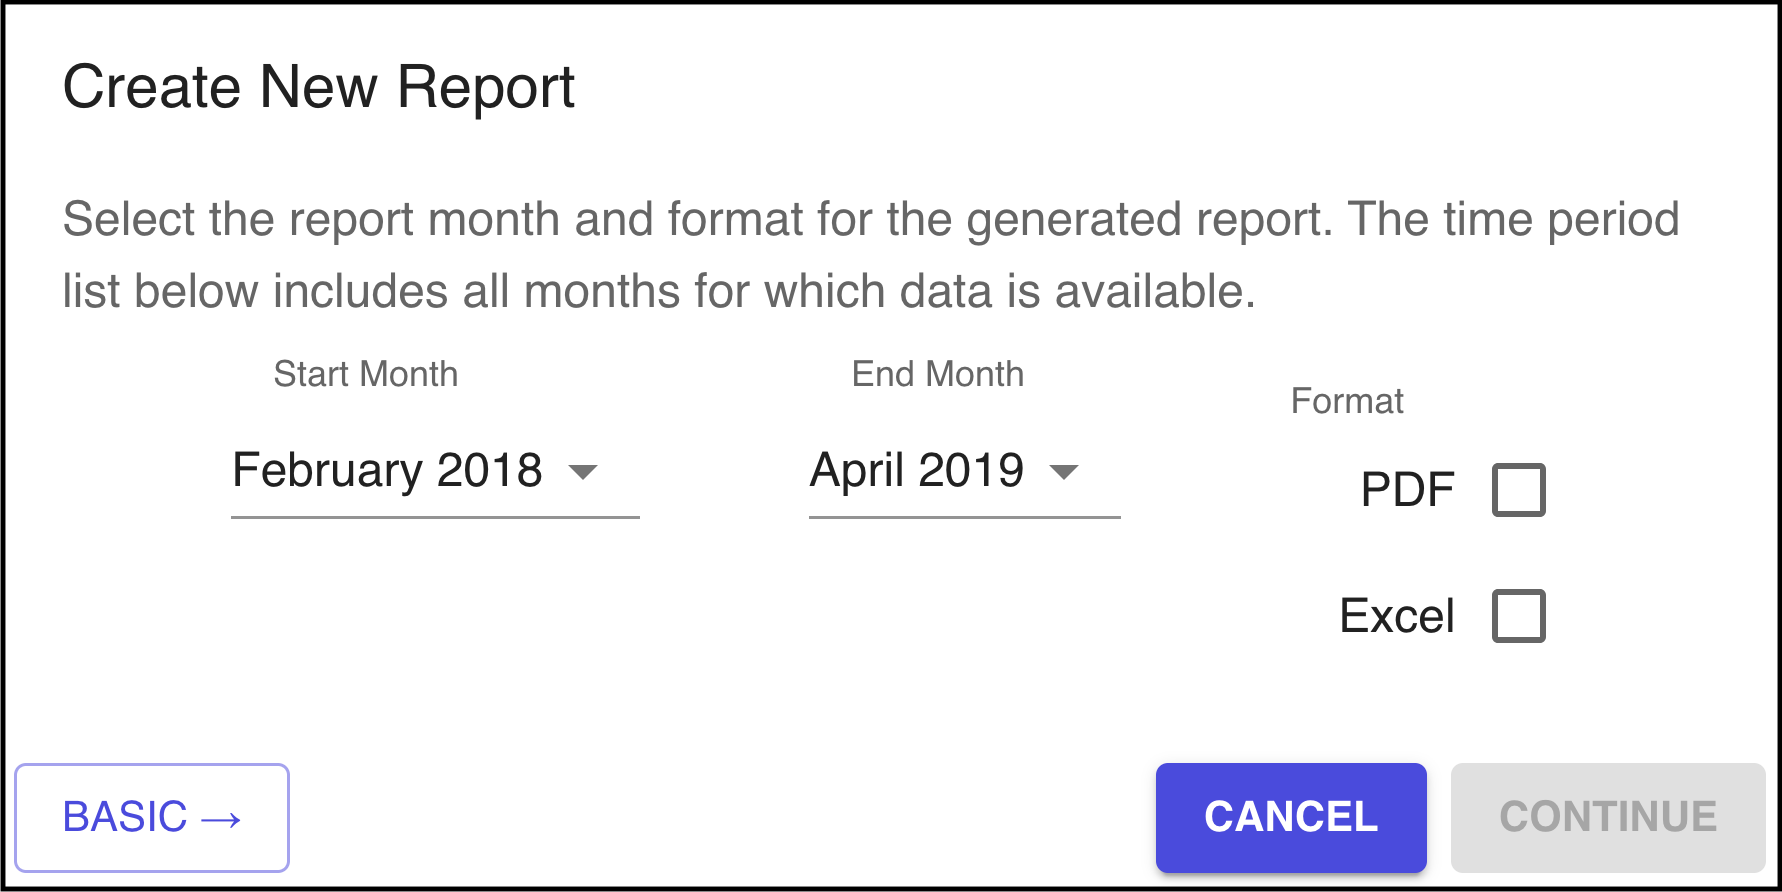
Screenshot 16 - Creating New Report (Advanced)